Market Takes An Abrupt U-Turn After Opening Sharply Lower.
 By
By
Finish Up Despite Russia Starting A War In U Up Despite
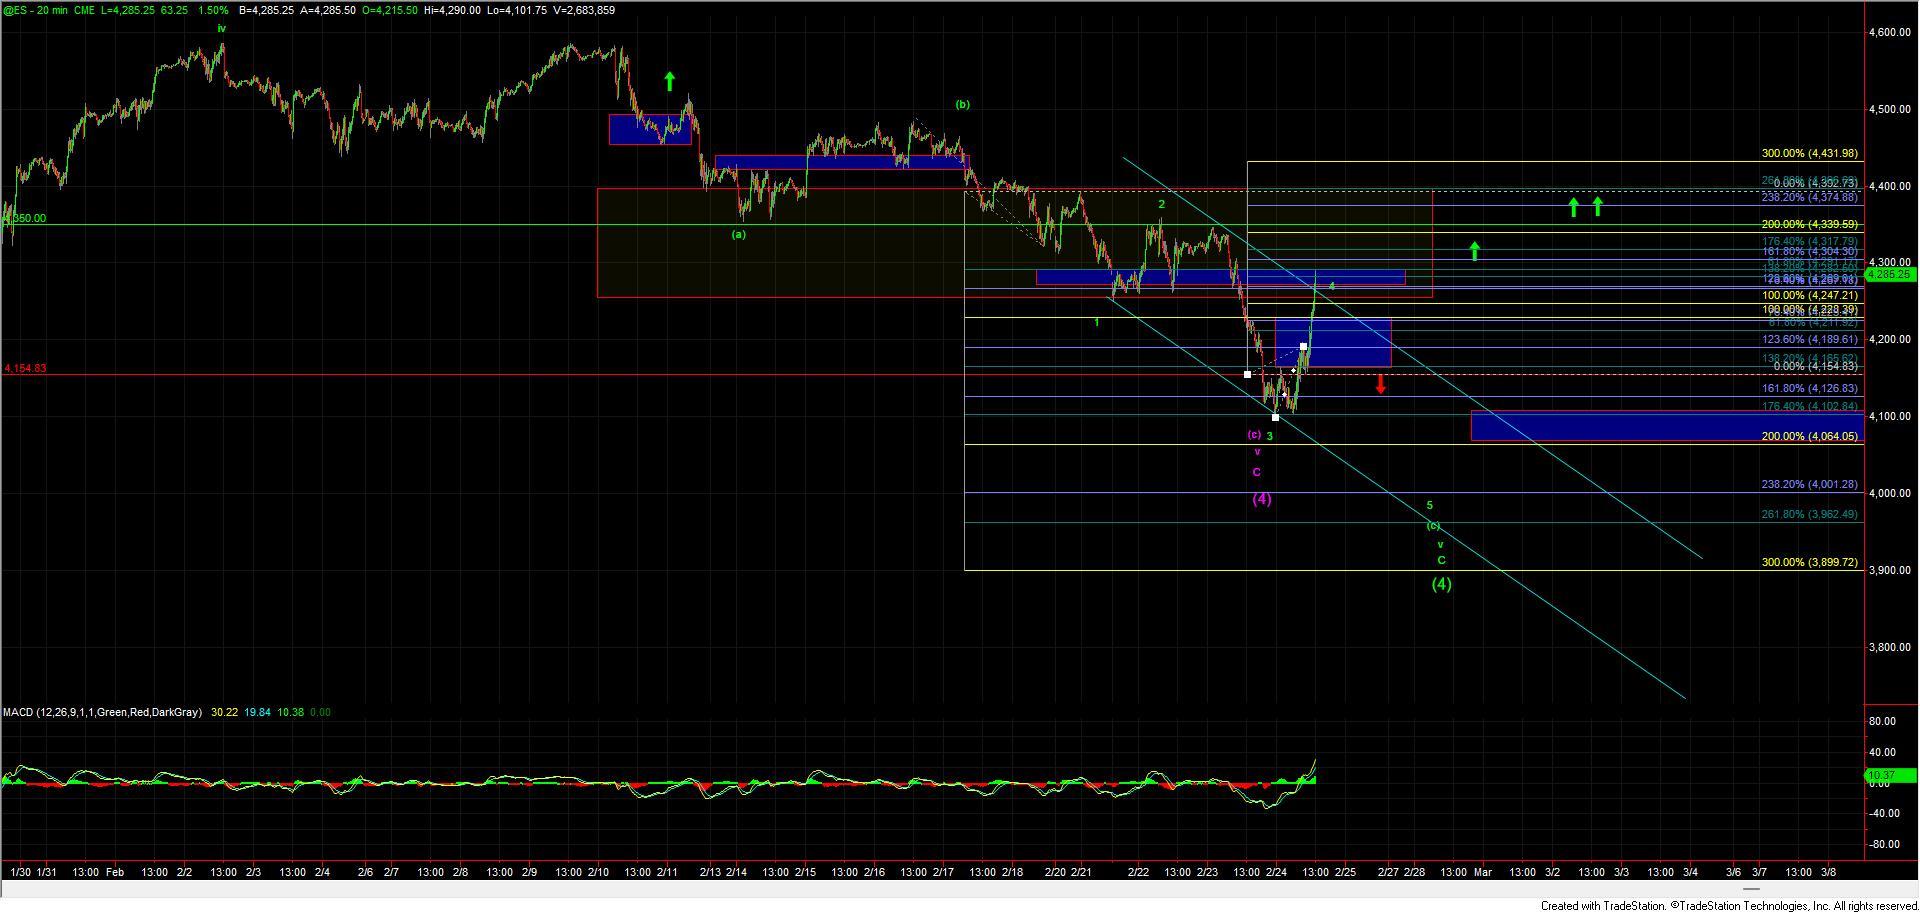
Today the market opened sharply lower but found support right at the 4100 level on the ES before seeing a sharp rally into the final few hours of trading. The initial drop lower did confirm the green count that we had been watching as the primary count which needed another lower low. The deep drop however did complicate the smaller degree charts just a bit as it extended beyond the ideal spot for our wave 3 but the larger timeframe charts are were still signaling that we were near a major bottom. The strong rally into the end of the day has cleared up the smaller degree counts quite a bit and really left us with only one reasonably probable path to new lows which if it does occur should be the final low before seeing a sharp reversal higher. Now with that being said this rally off of the lows is certainly the type of start that we would expect to see when a major bottom is struck so while the pattern still did not give us an ideal completed pattern into the lows we can make the case that a bottom in all of the wave (4) is completed. I am showing the primary count in green which would still argue for another lower low to complete the wave (c) of v of C of (4) whereas the purple count we would consider a bottom in place but still would need further price action overhead to confirm.
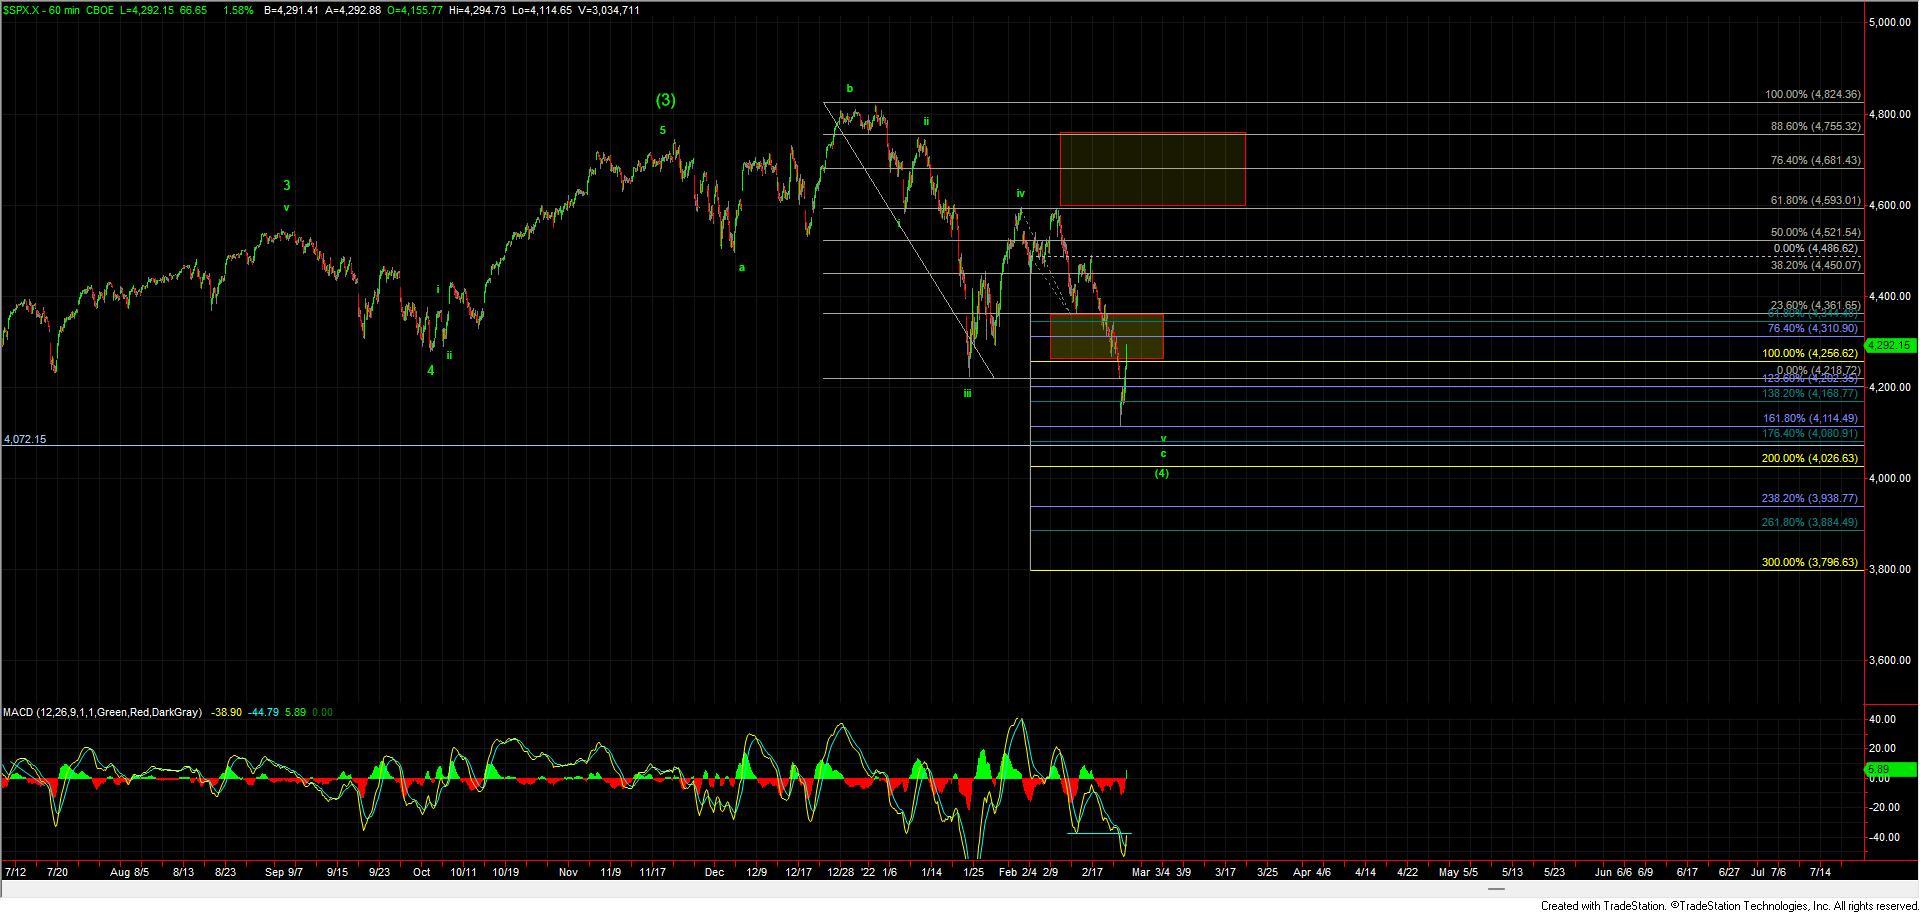
Under the green count, the low of the day would count as the bottom of the wave 3 of larger wave (c) finishing off the larger ending diagonal for the wave C of (4). That would make the current rally a wave 4 still needing another wave 5 down to finish off the pattern. Because we have already overlapped the wave 1 under this case it must count as an ED should we see that lower low. The ideal target zone for that lower low would come in at the 4064-4001 under that path. We should then see a very sharp rally back higher toward the 4600 level before breaking out to new all-time highs. The initial signal of a top under this case would come with a break back below the 4211 level followed by a break under the 4154 level. If however we hold over those levels and continue to push higher over the 4300 level and then the 4350 level then it would give us an initial signal that we have bottomed in all of the purple wave (4).
Under that purple count, we should hold that 4211 level and then push higher and fill out a full five wave move up off of the lows into the 4340-4400 zone. This should then be followed by a corrective retrace lower and another push over the top of that five wave move. If we fail to see a full five up then it makes it less likely that the purple count is going to follow through and it would signal that a lower low is still likely needed.
So while today's action was certainly wild it was also productive in giving us parameters for finding that ultimate bottom in the larger wave (4). So whether the ultimate bottom is in place or not we have so far followed the larger degree path fairly well and based on all of the evidence we are seeing on those charts this region should certainly be viewed as an opportunity with still plenty of longer-term upside remaining.