Market Still In A Holding Pattern
Today the market poked to another higher high in the early session only to move back lower as we approach the end of the day. We are still only slightly down from yesterday's close and well over even upper support. So with that today's action really did not change anything in regard to the counts that we have been watching and they all remain valid at this point in time.
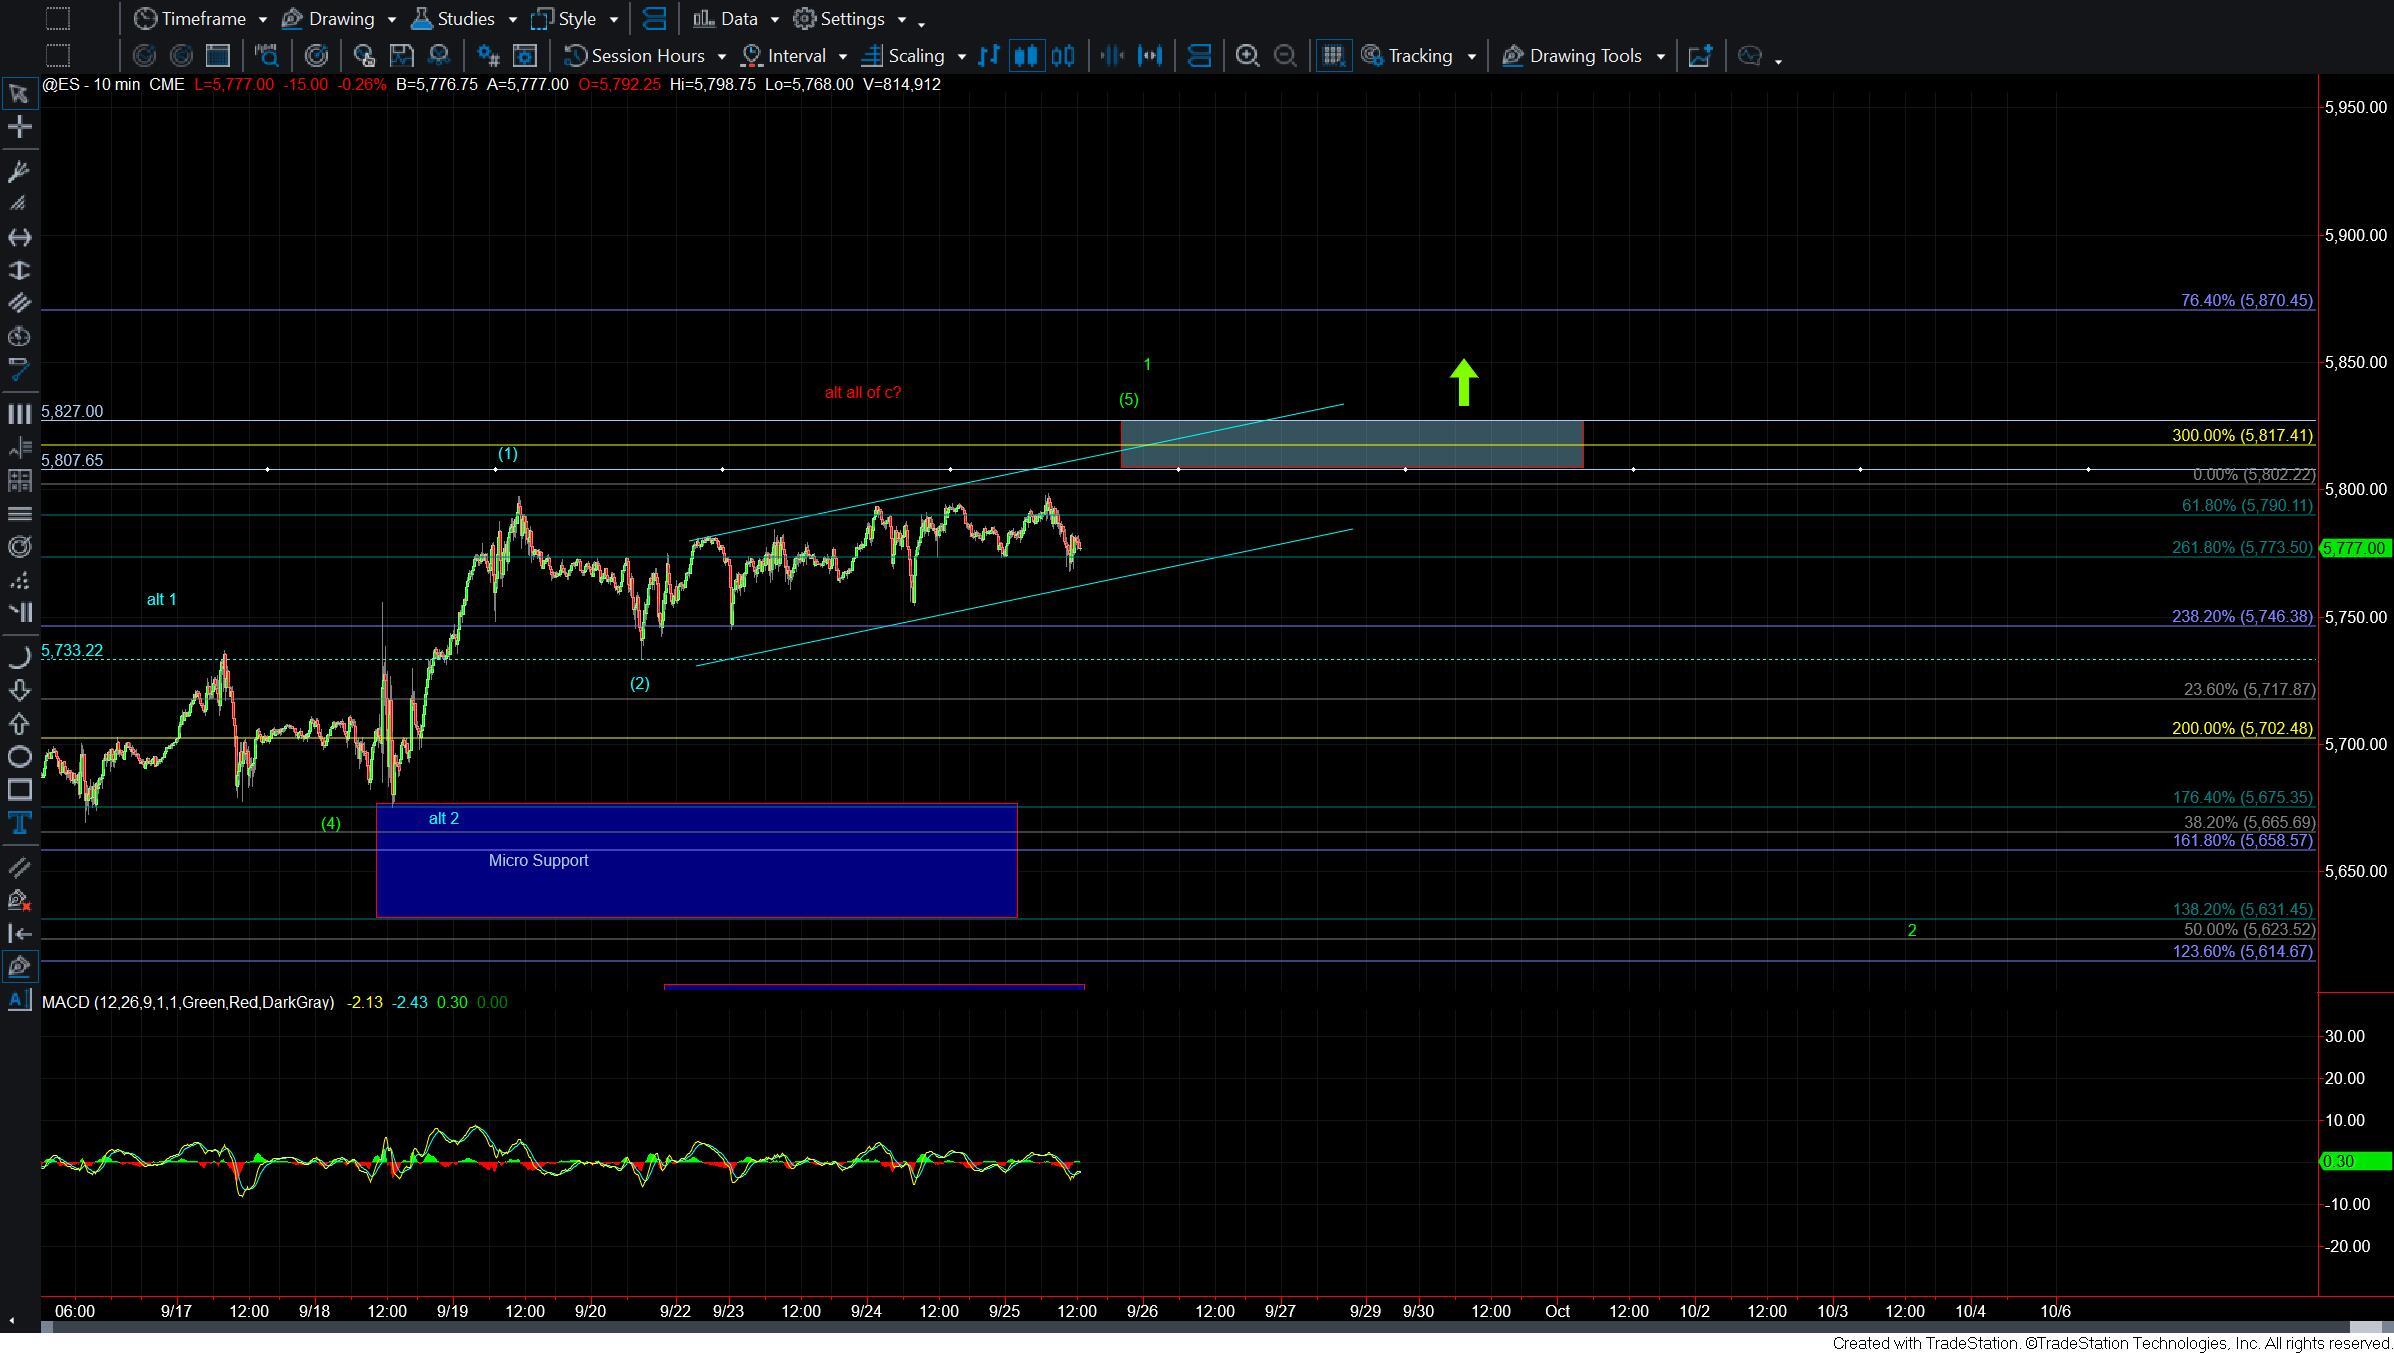
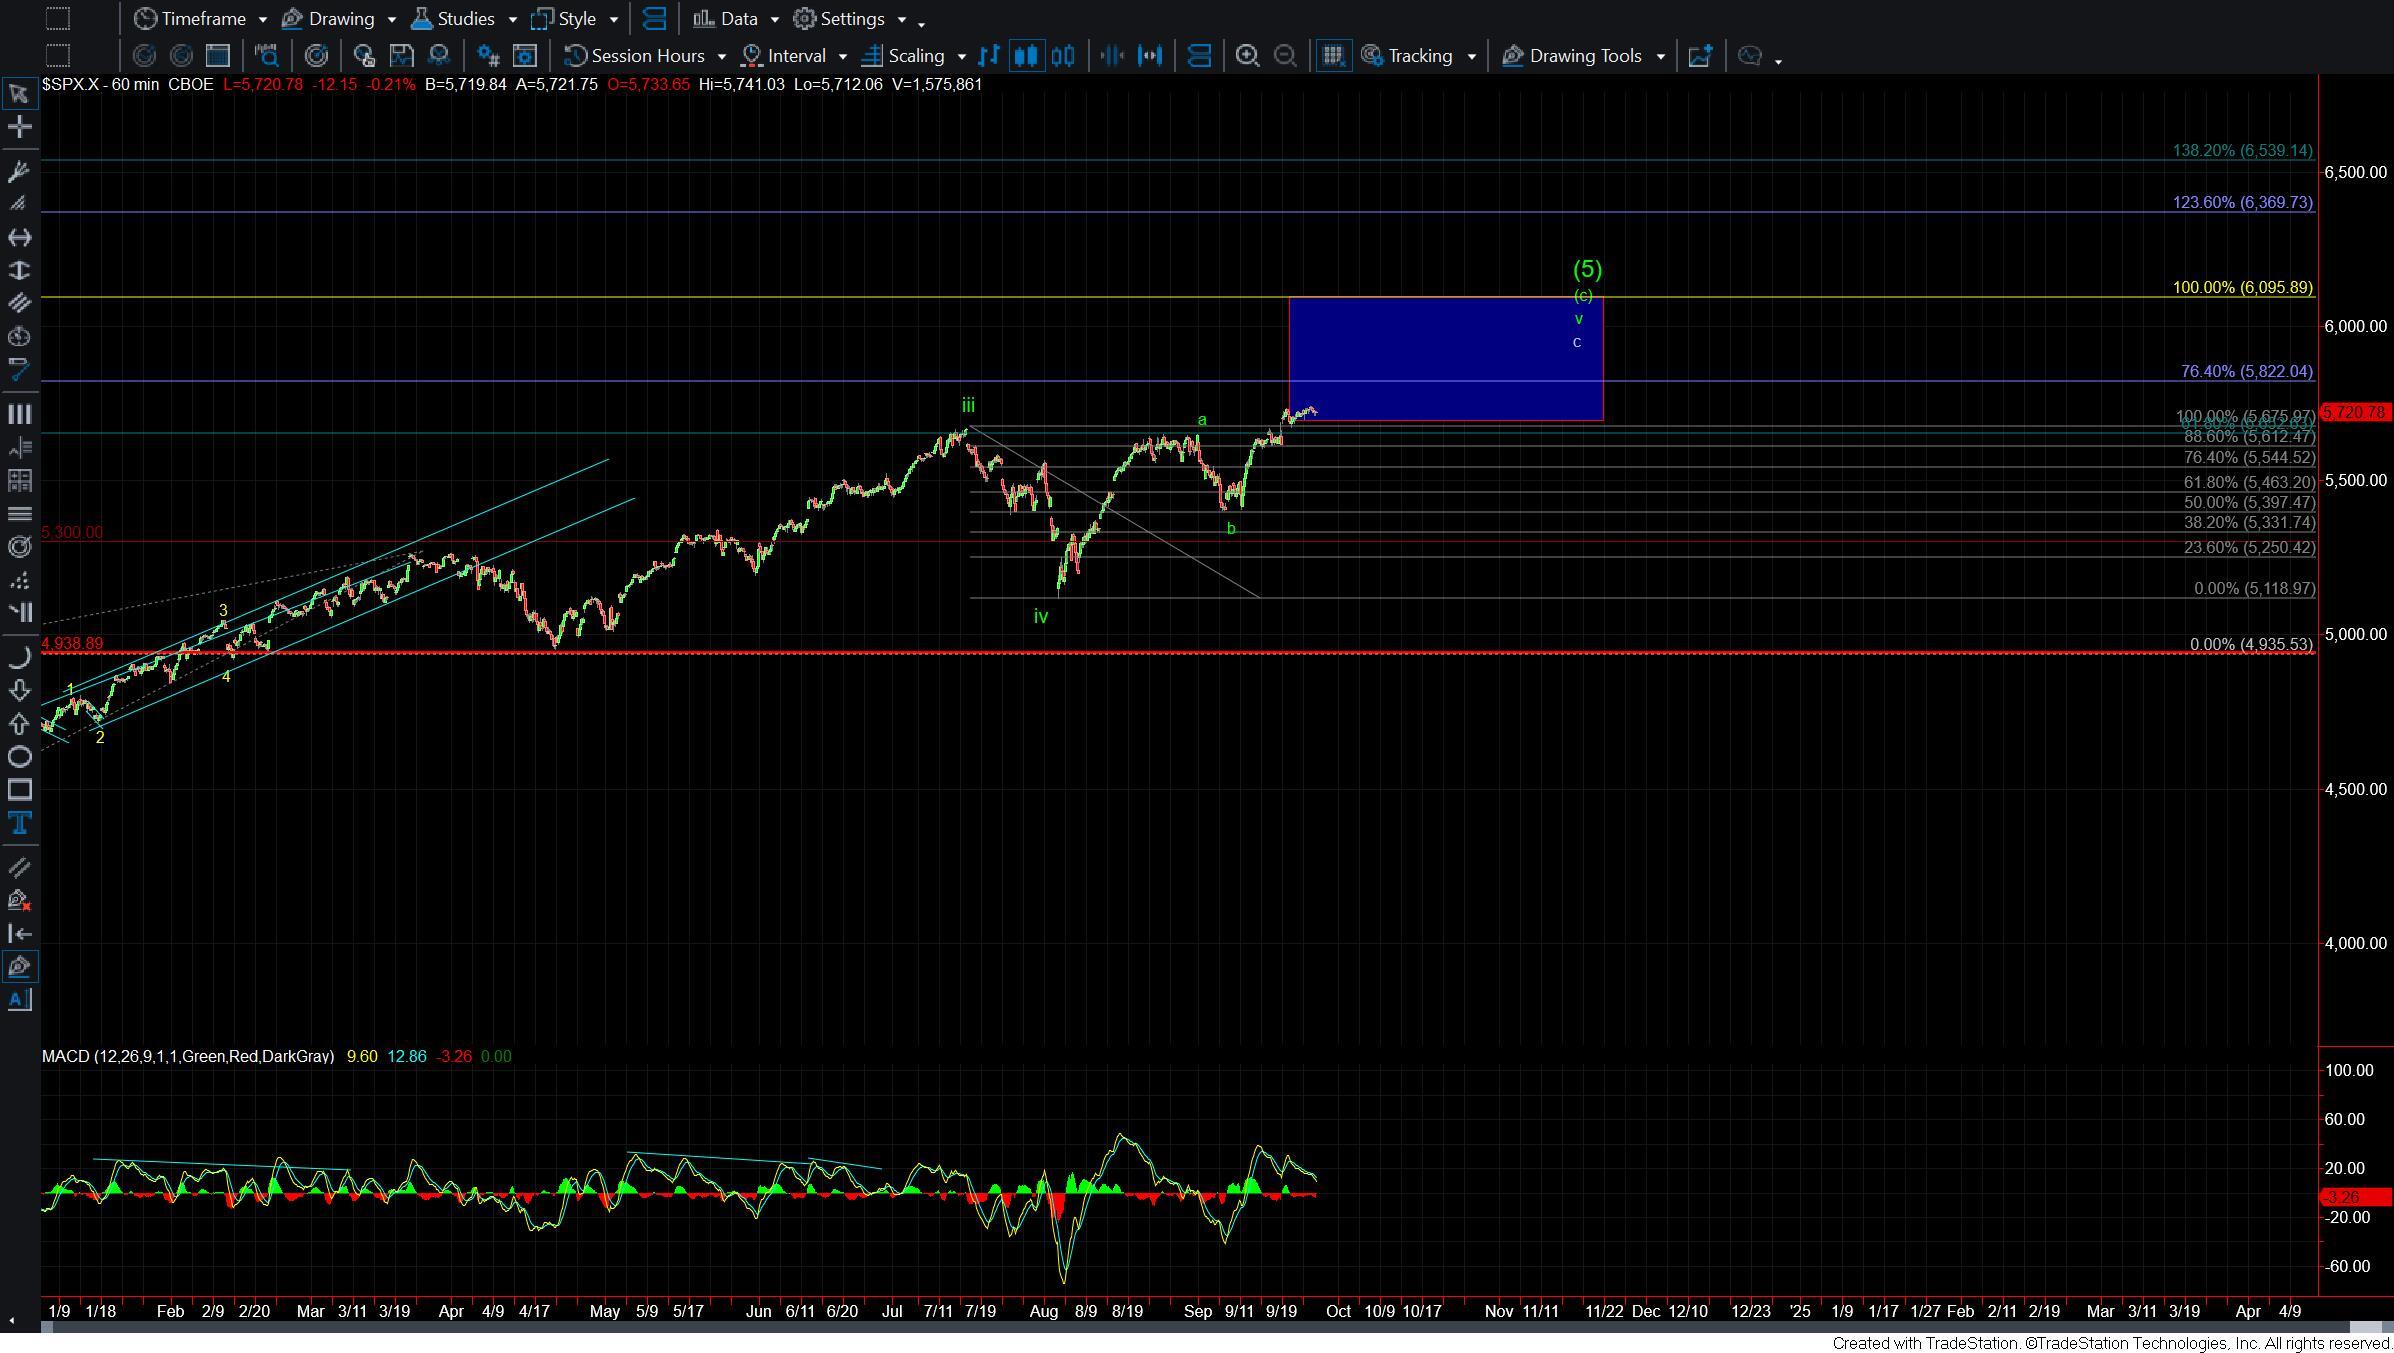
As laid out on the ES chart the two main counts we are watching are shown in green and blue. The blue count is more immediately bullish and should we see the market hold over the 57333 level and then breakout over the 5827 level it would make it more probable that we are going to see a direct breakout higher per that blue count. This should ultimately take us up over the 6000 level to complete the larger degree c wave after having bottomed in all of the wave b earlier this month.
Should we see a break back under the 5733 then it would invalidate the most immediately bullish blue count and likely put us in the green count. Udner that case I would be looking for a pullback toward the 5675-5529 region before breaking higher once again to finish off the larger wave c towards the 6000 region.
If we were to see a full five-wave move to the downside followed by a break under the 5529 level then it would open the door for a larger degree top to be in place however we still have quite a bit of work to do to suggest that this is indeed the operative count. So for now as long as the pullbacks remain corrective we still do not have any signal that a larger degree top has been struck on the SPX just yet.


