Market Still In A Holding Pattern
 By
By
Today the market opened flat and stayed flat into the afternoon session. With that flat market, there is still not too much I can add to the analysis other than what has already been said over the past few days.
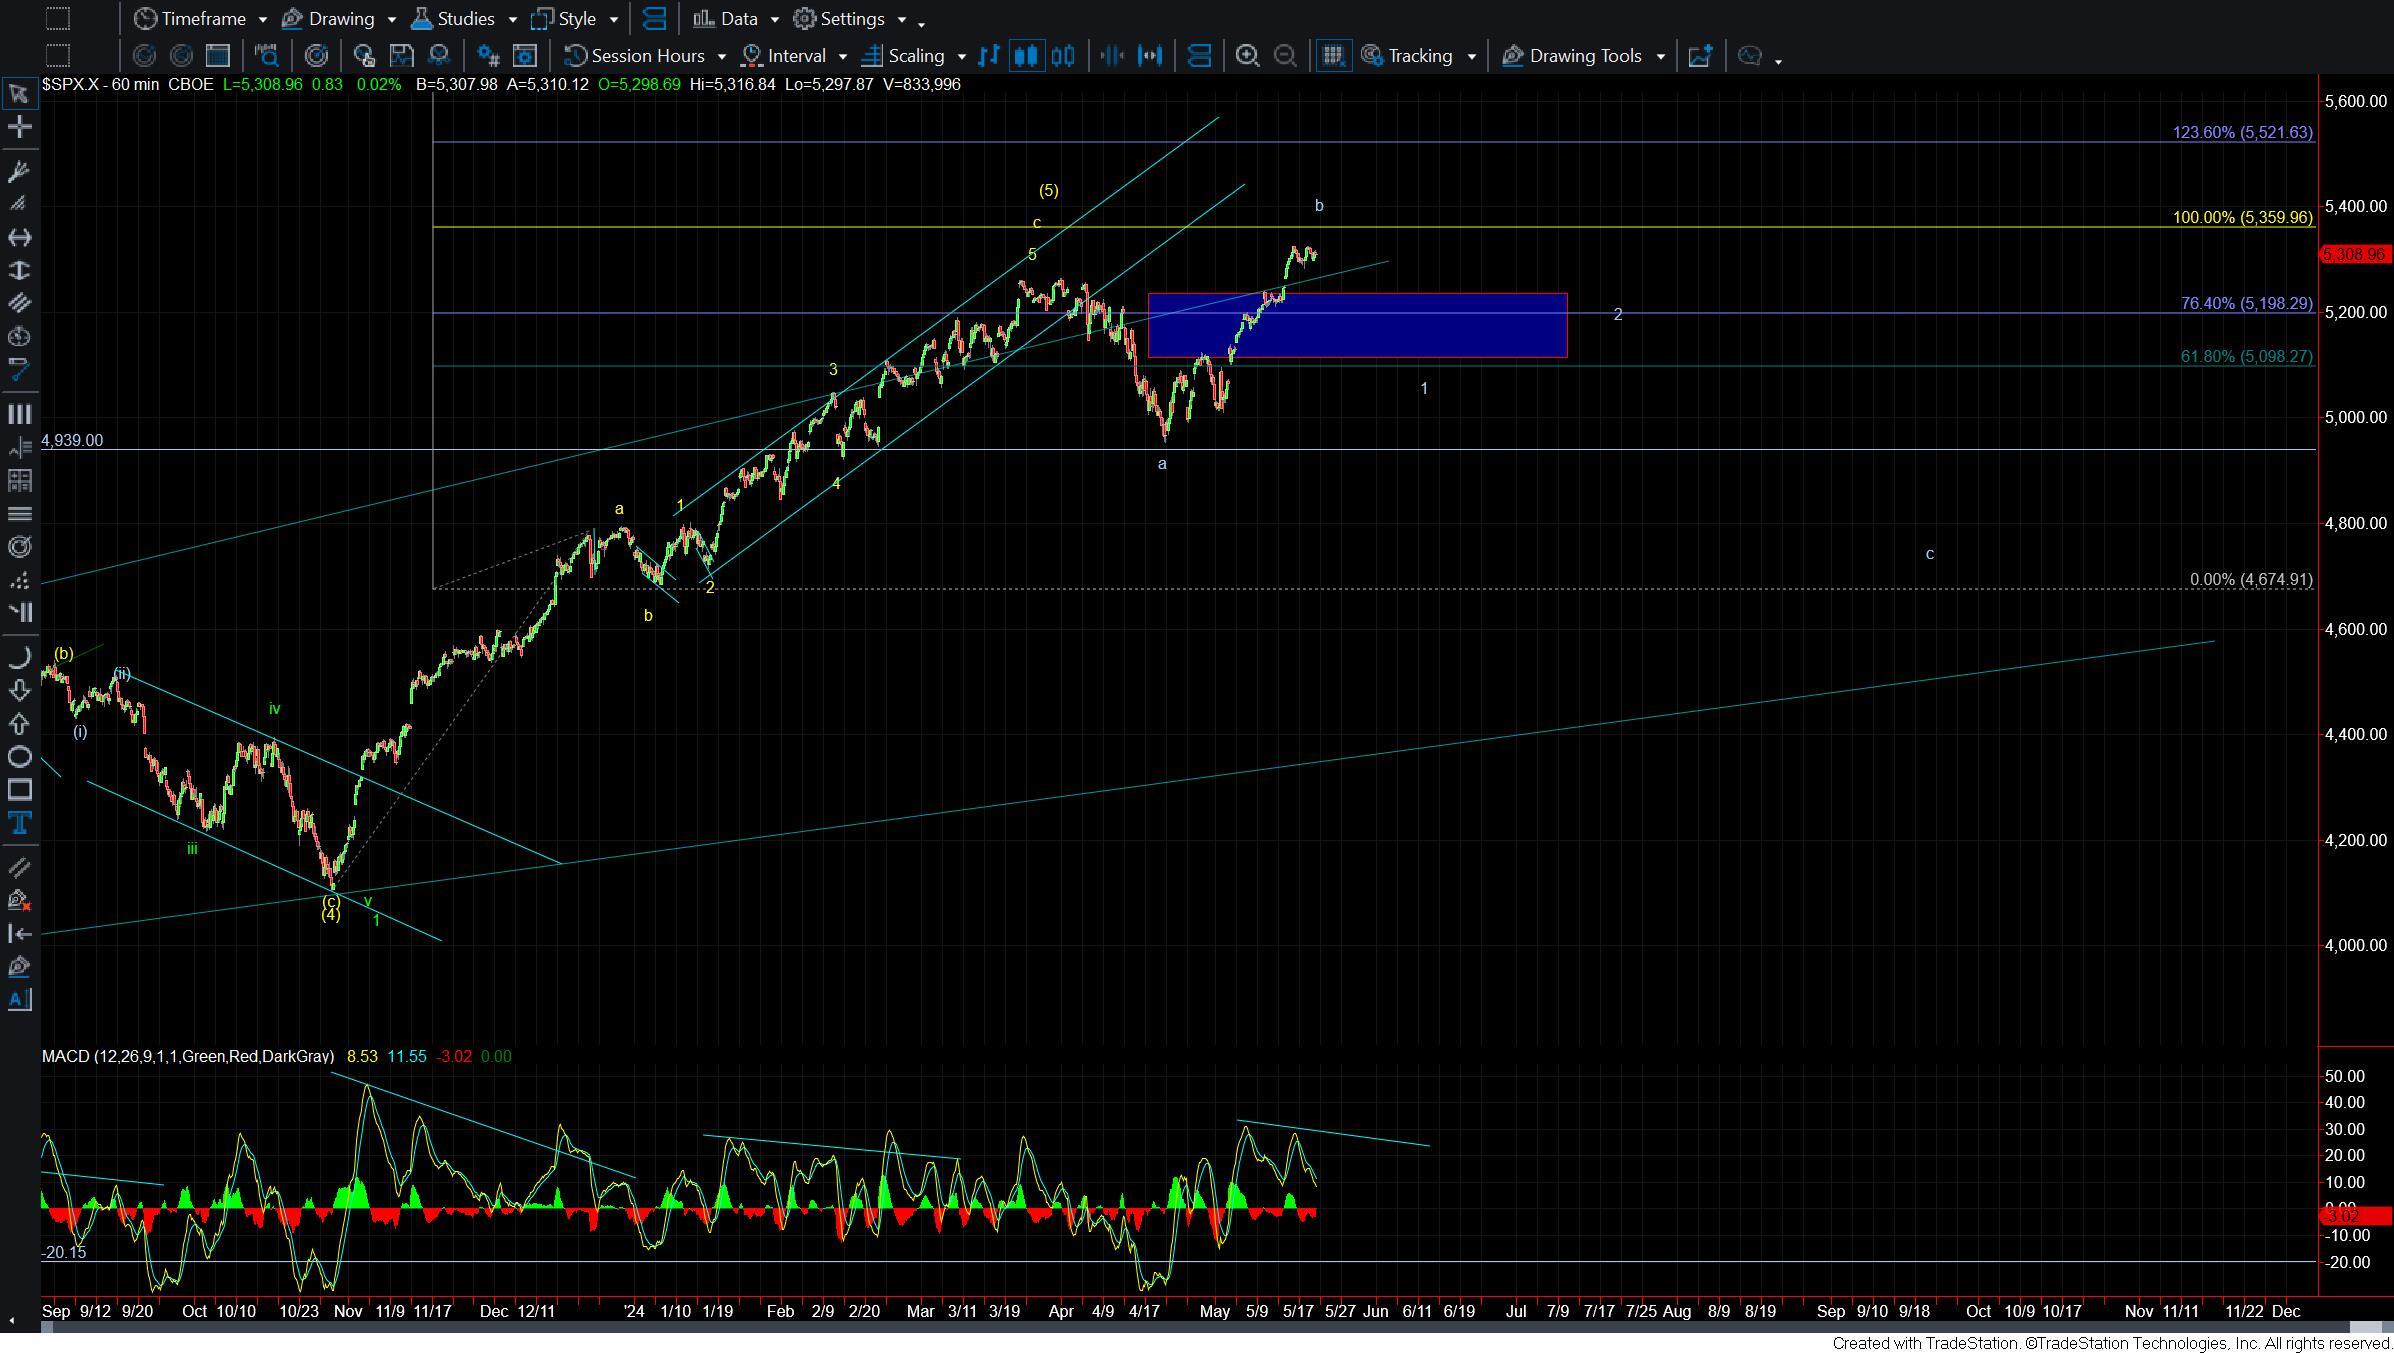
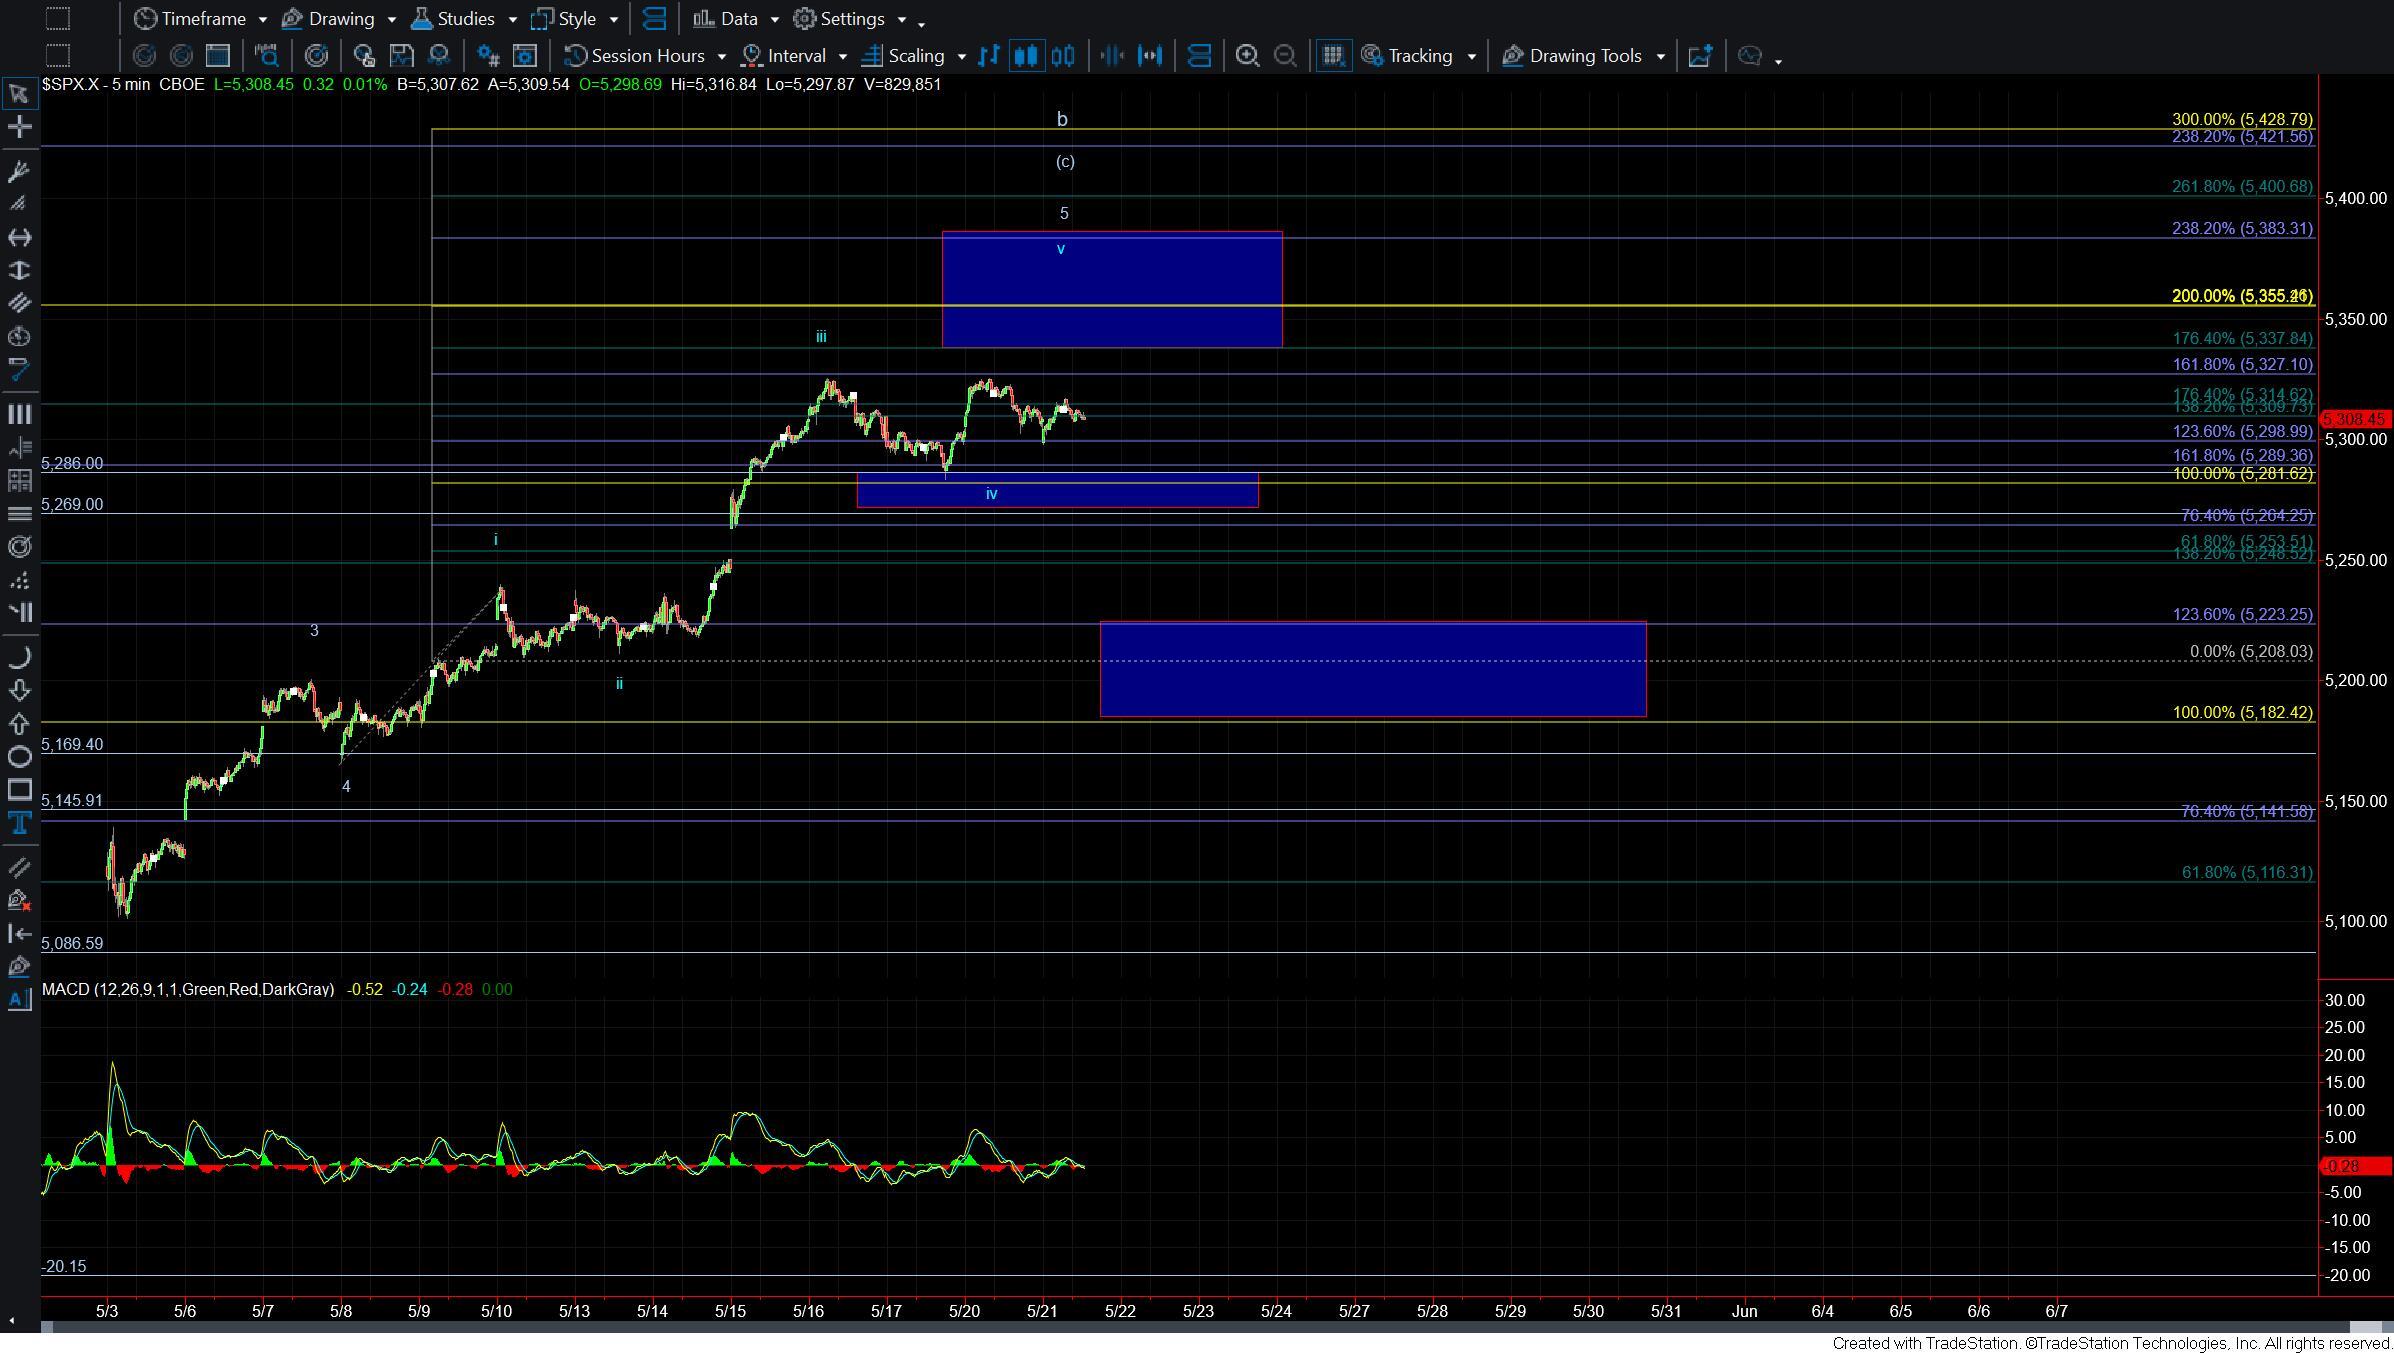
As I noted this yesterday as long as we are over the 5269 level then we still can see this push to another higher high to finish off the wave v of 5 fo (c) of larger wave b. The micro price action over the past several days is also not terribly clear and the move-up yesterday did not give us a clean break of the previous high cleanly satisfying the wave v of 5. Furthermore, today's action is equally sloppy. So with that, I am going to be watching the price levels noted to give us better guidance from here. If we do indeed break higher then I will be watching the 5327-5383 zone overhead as the next key overhead resistance/target zone.
If and when we break under that 5269 level then it would give us a very early signal that we may have topped in all of the wave b but we still would need to see that followed up with a full five down off of the highs and a break under the 5223-5182 zone below to further confirm a top. From there we can see the size and depth of the initial five wave move down off of the highs to give us a better idea as to what the next larger degree target to the downside will be.
For now, however, and as noted yesterday we simply need to continue to be patient, and cautious as the market navigates what we are counting as the final stages of this larger degree pattern.