Market Still Holding Support For Now
 By
By
After seeing a fairly sharp drop into support yesterday afternoon today we saw the market move back higher once again. This hold of support and move higher today is very much keeping the more immediate bullish count in play and in fact, the pattern on the RTY(IWM) is still supportive of this count. If we can continue to hold support and move higher in the days ahead it would give us further confirmation that we are indeed following the more immediately bullish count.
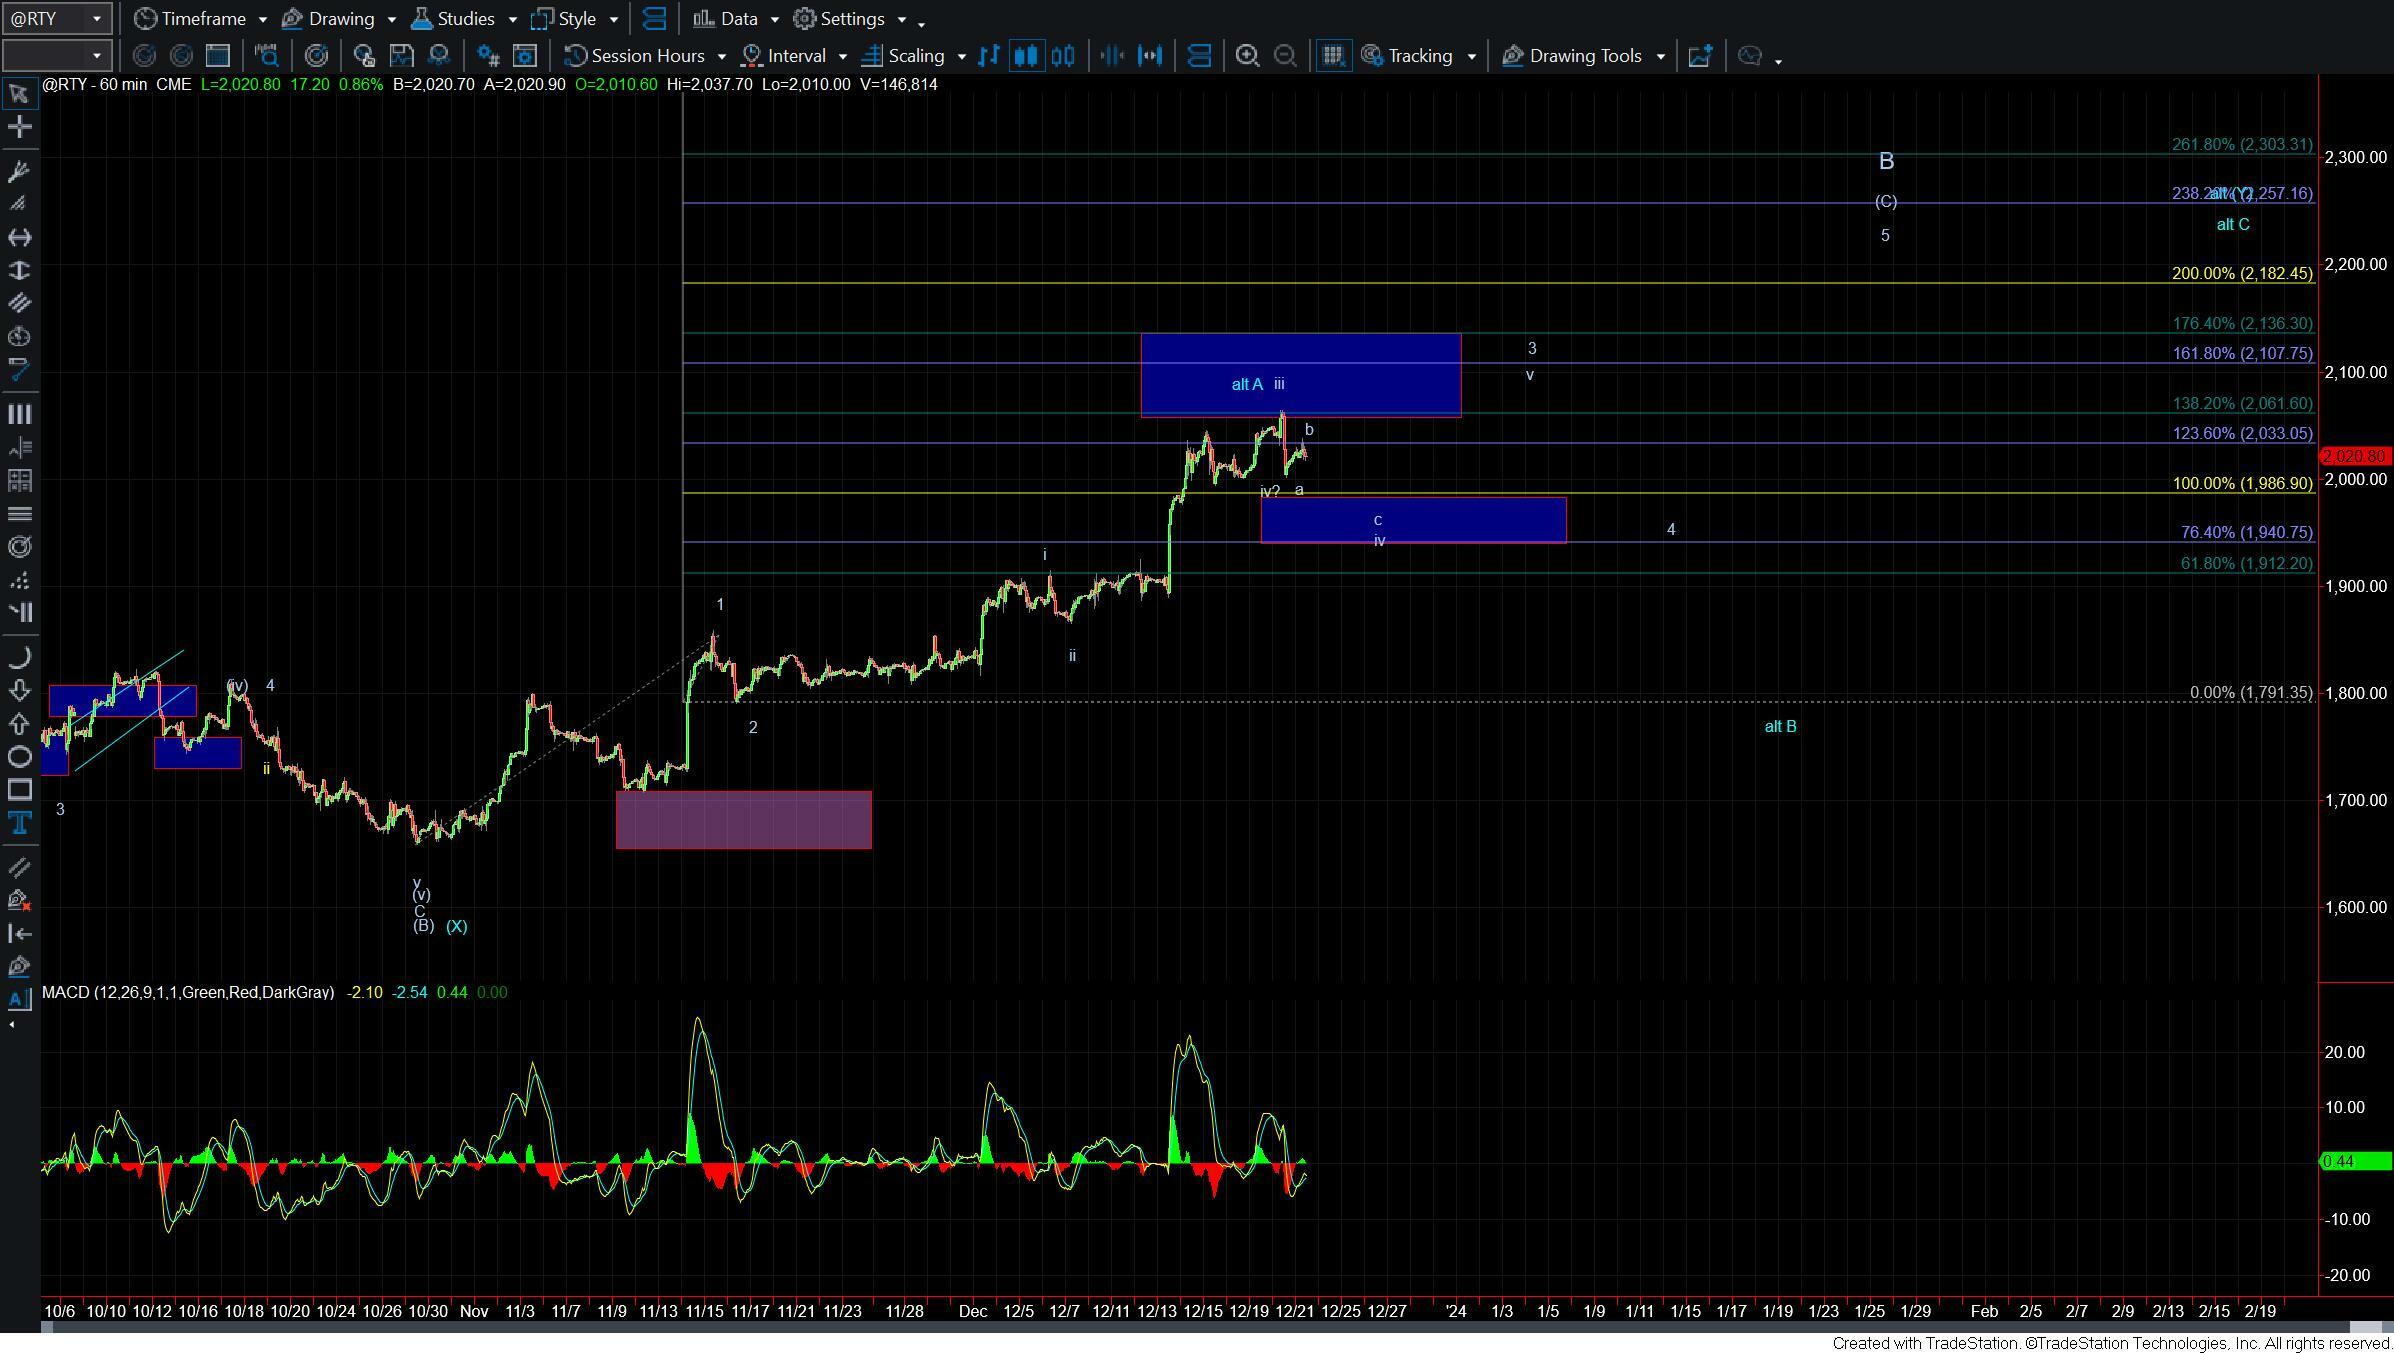
As Avi noted yesterday the Russell 2000 (RTY/IWM) is following a much cleaner pattern at the moment. For this reason, this is the more reliable chart to as it is giving us cleaner Fibonacci Pinball guidelines to follow. So looking at the RTY chart we can see that we are still well over even upper support for the wave iv of 3 which comes in at the 1986-1940 region. As long as this zone holds then the pattern looks incomplete to the upside and we are likely to see this continue to push higher.
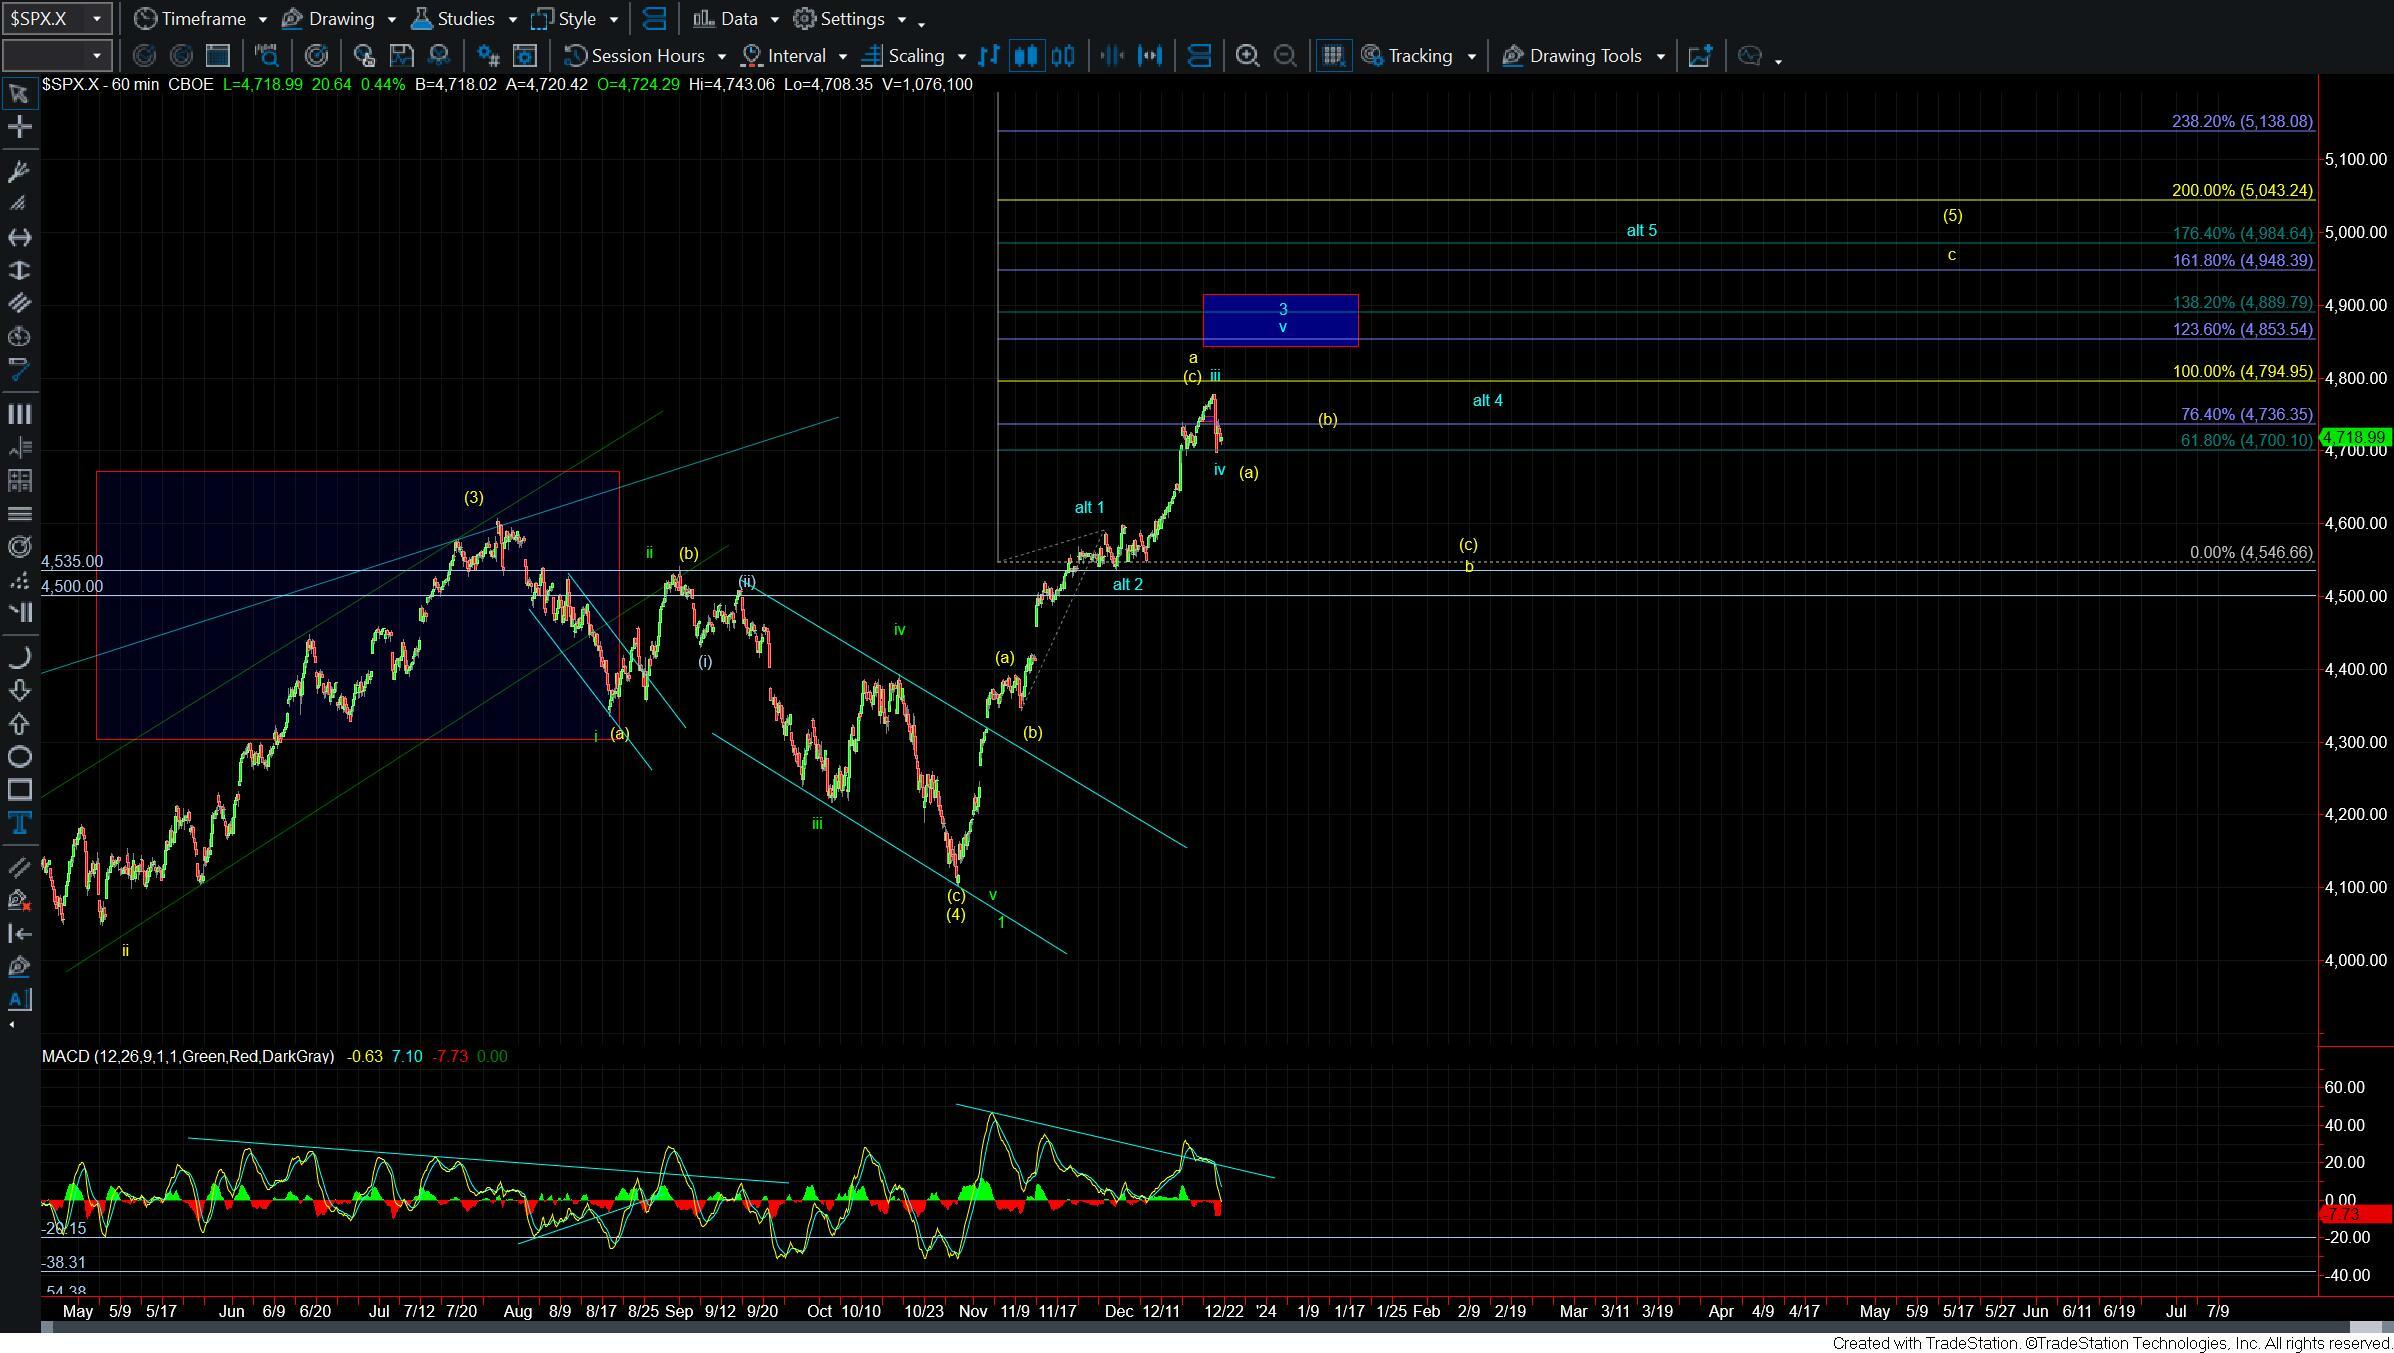
The bigger question I have on this chart is whether we have already bottomed on all of the wave iv or if we still need to see that wave iv move a bit deeper into that support zone. The SPX chart is already deeper into the support zone so using that chart in combination with the RTY chart the cleanest pattern would be for this to hold the low that was struck yesterday and move higher. Under that case, I would be looking for a move into the 2107-2136 region on the RTY and the 4853-4948 zone on the SPX.
If we are unable to hold yesterday's low on both the SPX and the RTY it would complicate things a bit as the SPX would be below the ideal support. That said given that the RTY is still tracking the cleaner count I would still allow for this to continue to push directly higher per the more immediately bullish count as long as the RTY is holding the support zone noted above.
So while overall the pattern has been a bit sloppy on the SPX we do have the RTY giving us a fairly clear path to follow. So for the time being as long as the RTY continues to follow our Fib Pinball guidelines, this will be the more accurate chart to watch and help to give us better guidance as to where we are heading in the near term.