Market Still Grinding Lower But Still Still Over Support For Now
 By
By
Today we saw the market continue to grind lower in what has been fairly overlapping wave action over the past several trading sessions. Furthermore were are still well over key support below which is not giving us any signal that we have in a bottom just yet. While I still cannot rule out that we will see a sharper more immediate breakdown as long as we are holding over support there is no signal of that just yet.
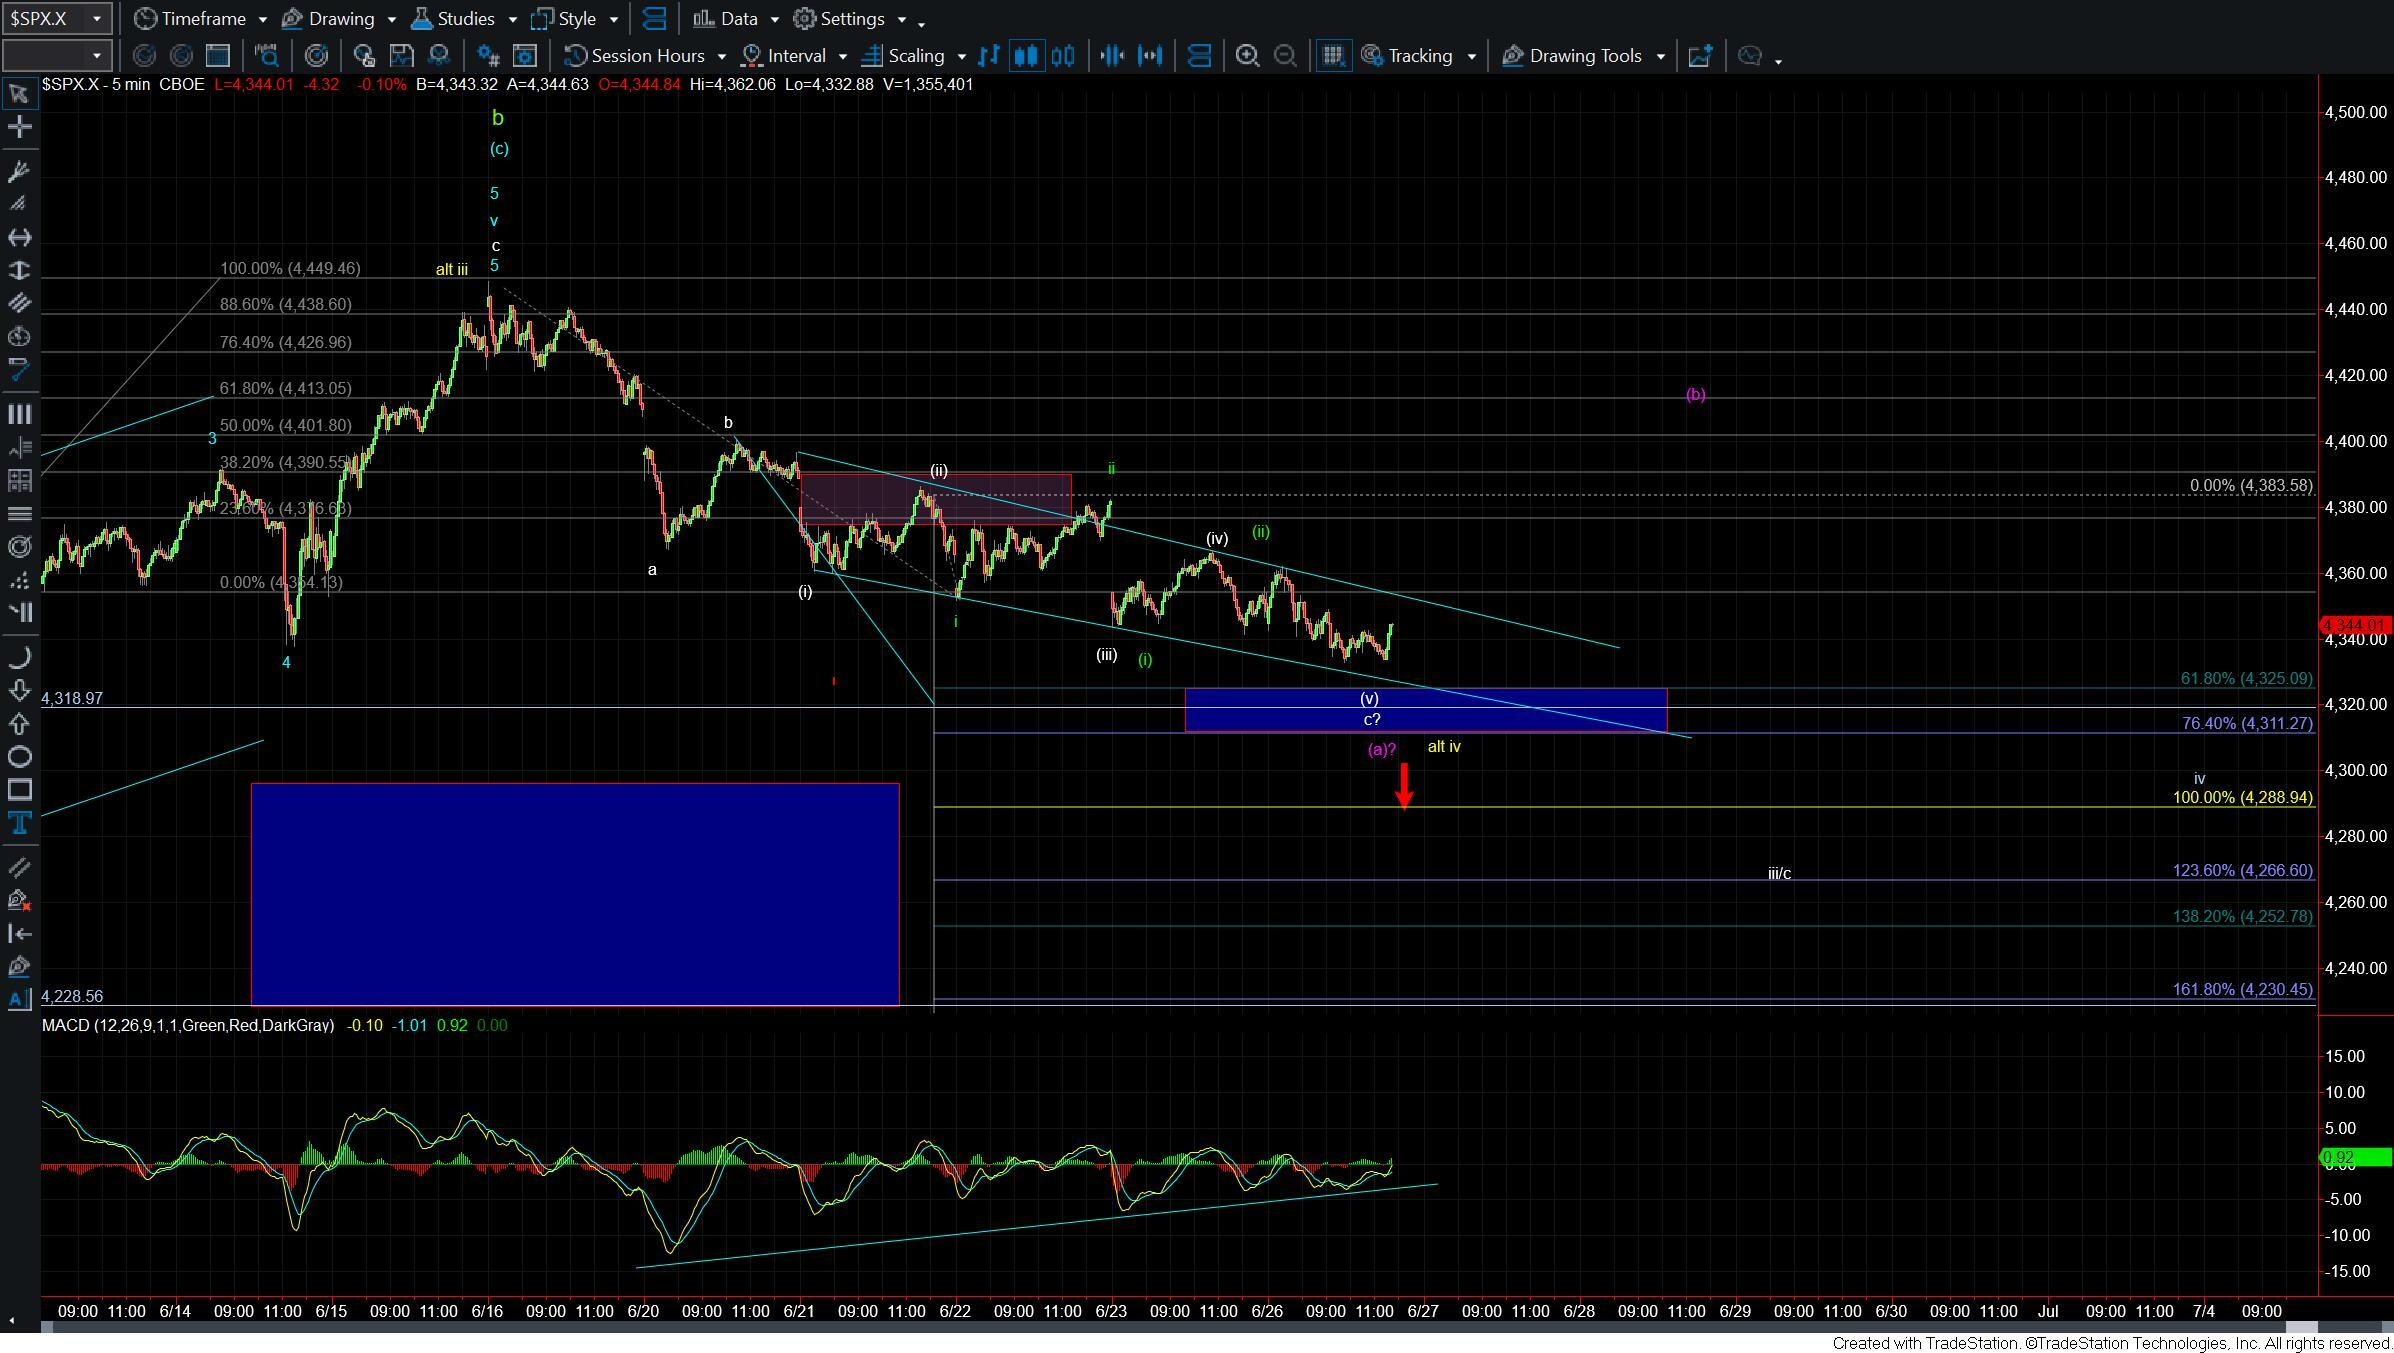
Overall there is not too much change on the smaller degree timeframes as shown on the five-minute chart. I am still watching the Ending Diagonal count which I am now showing in the white subwaves on the chart. Again this has not changed however I did change to colors of the subwaves to clean the chart up a bit as this ED could be part of either the yellow or purple counts on my 60min chart.
Under this Ending Diagonal count we should find a bottom around current levels and ideally above the 4325-4311 support zone. Upon bottoming we should see a fairly sharp reversal back up towards at least the 4400 level which is the origination point of that ED. From there I will watch the structure of the leg up to help determine whether we are following the yellow or purple counts. If we were to see a full five up off of the lows then it would suggest we are heading higher in the yellow count. If we were to see a three-wave move then the purple count becomes more likely
If we break under the 4311 pivot and follow that up with a break under the 4288 level then it would open the door to the more immediately bearish green count and nested i-ii (i)-(ii) down. We still would need to see further follow-through in the form of an impulsive wave structure to confirm the top of the wave b however seeing a sustained break through the 4311 and then 4288 support levels would certainly be a good start to this count.
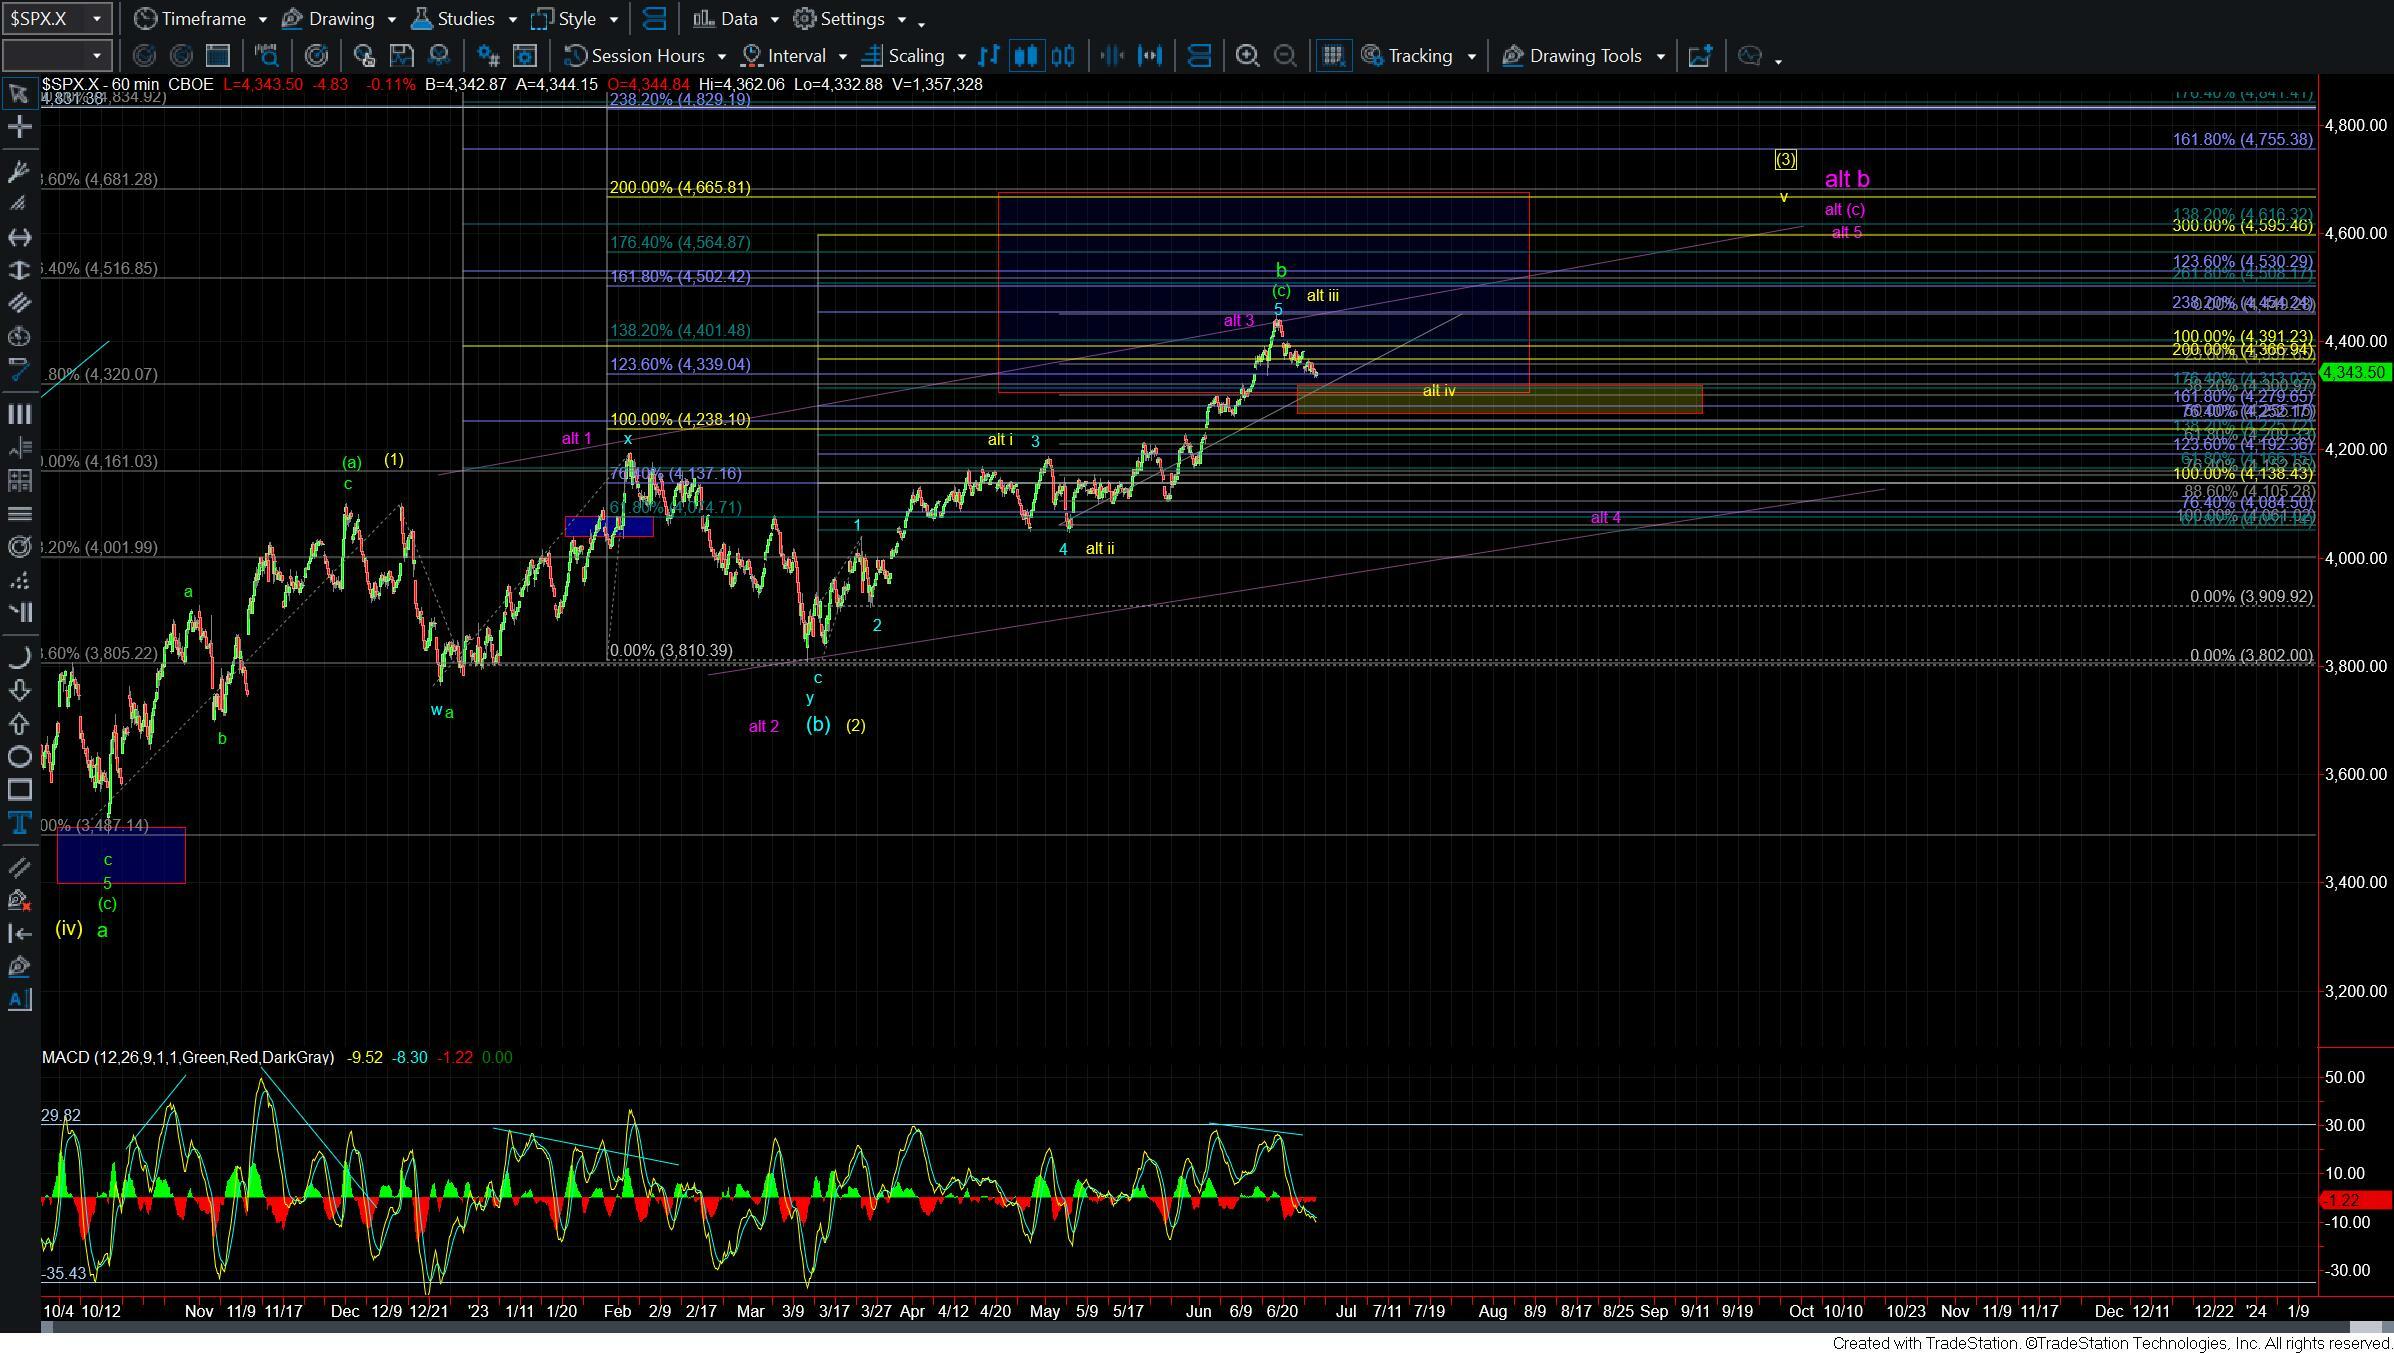
Bigger picture there is nothing really new to add and I am still watching the 4265 level as the key larger degree support. Moving through that zone upon five waves is early signal that we have topped in the green wave b. Moving through that zone on three waves would make the purple count more likely. Holding that zone and turning up on five waves makes the yellow count to new highs most likely.
So while today has overall been quite slow I think we should have a bit more information in the next few days as we are running out of room on the ED count. If we are unable to break higher under that count but rather break through the pivot below then we can look towards the lower counts. If we hold and break higher then we have to watch the structure and overhead resistance to help give us guidance as to whether we are indeed heading directly to new highs or will see a more complex pattern develop. Again in either case the paramaers are fairly clear here and it is simply a matter of watching those price levels and structure as we move through the pattern over the next several days.