Market Still Correcting - Market Analysis for May 26th, 2021
 By
By
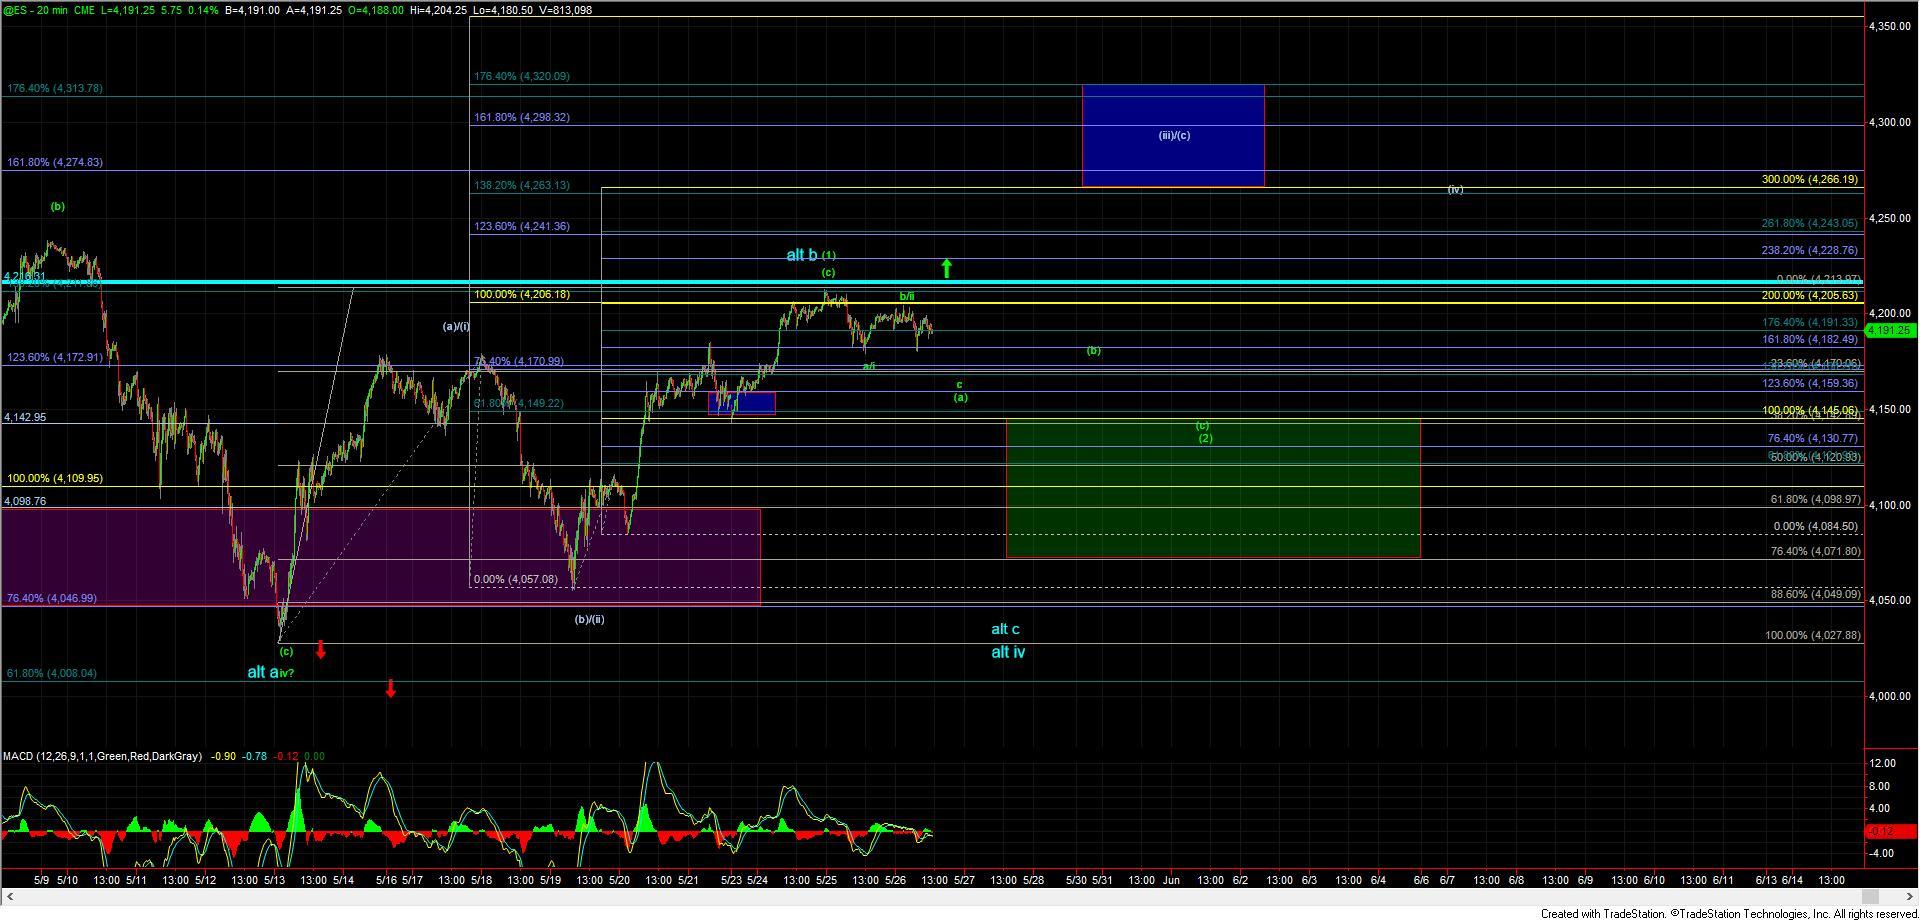
Yesterday we saw the SPX/ES pullback after hitting the key 4205/4206 resistance level that I had been laying out for several days. Overnight the ES futures saw a move higher which stopped short right at the upper end of the key micro resistance level for the potential wave (b)/(ii). We then saw a fairly sharp drop in the early trading session. We have since recovered some of the drop and are trading a bit higher in the afternoon session but overall the SPX/ES is still for the most part flat from where it closed yesterday.
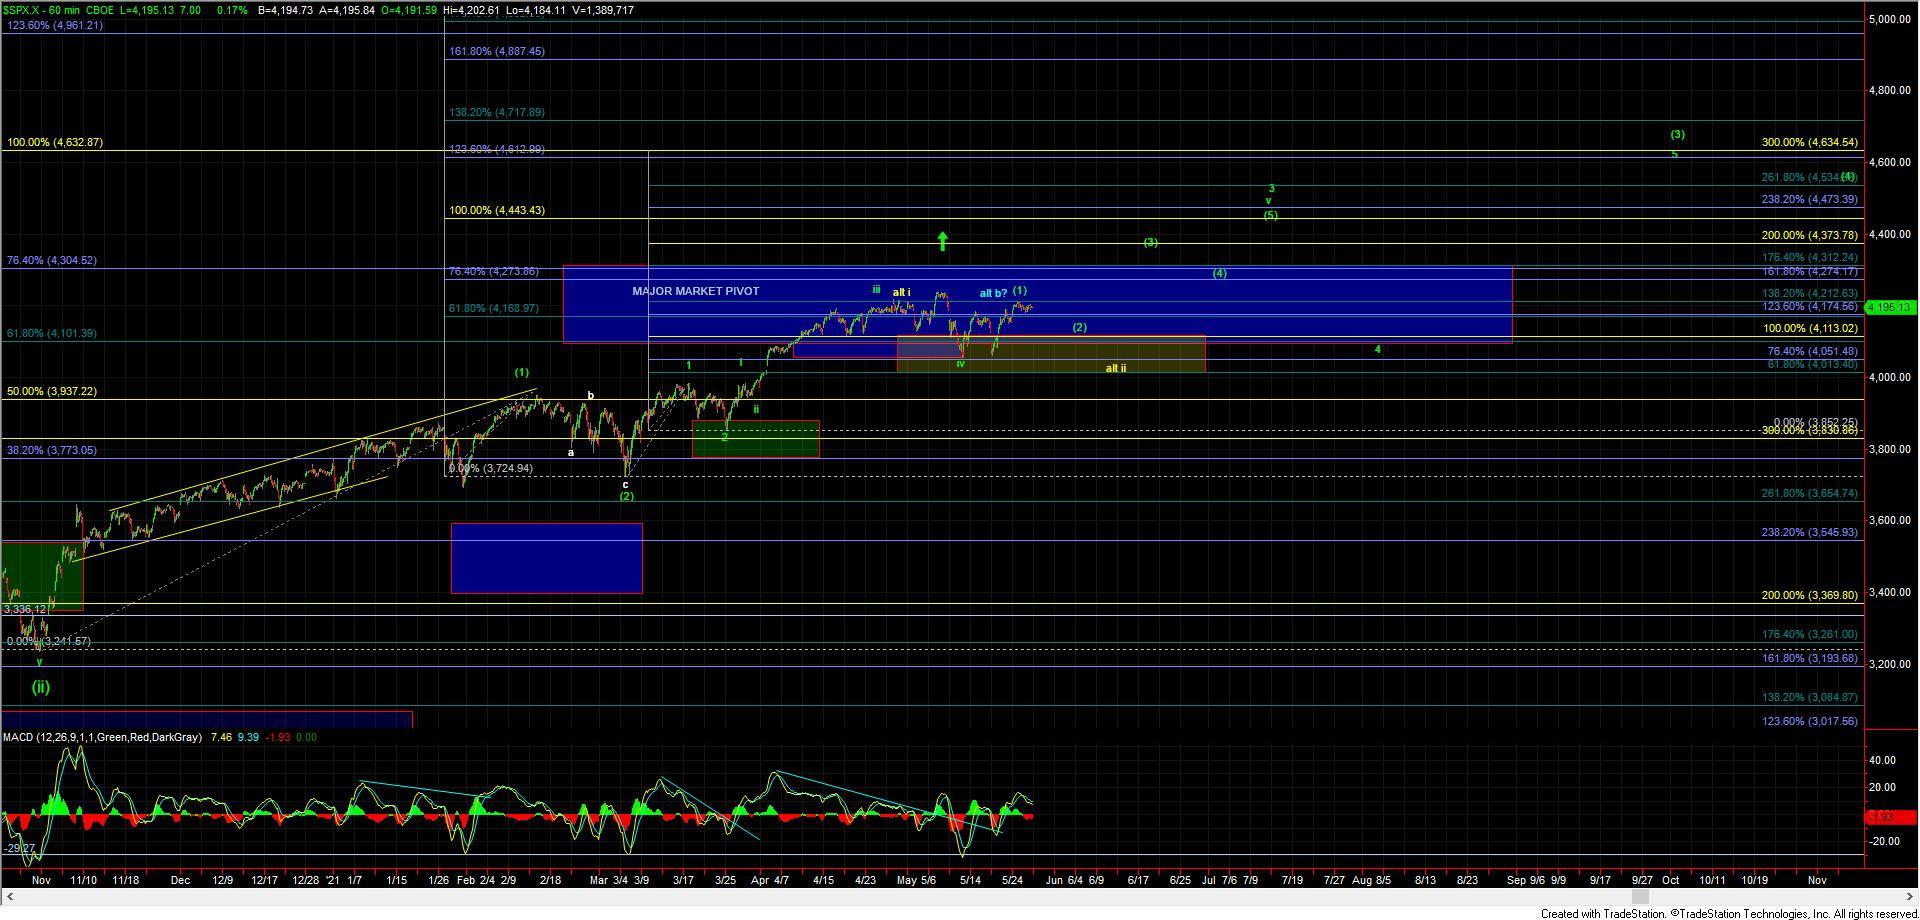
So with that and as noted yesterday the ES and SPX still would look best with a deeper pullback for a wave (2) which ideally should hold in the 4142-4071 zone. So again while a deeper pullback still remains the base case the overall and larger degree pattern is still quite bullish here as long as we can hold that 4142-4071 support zone.
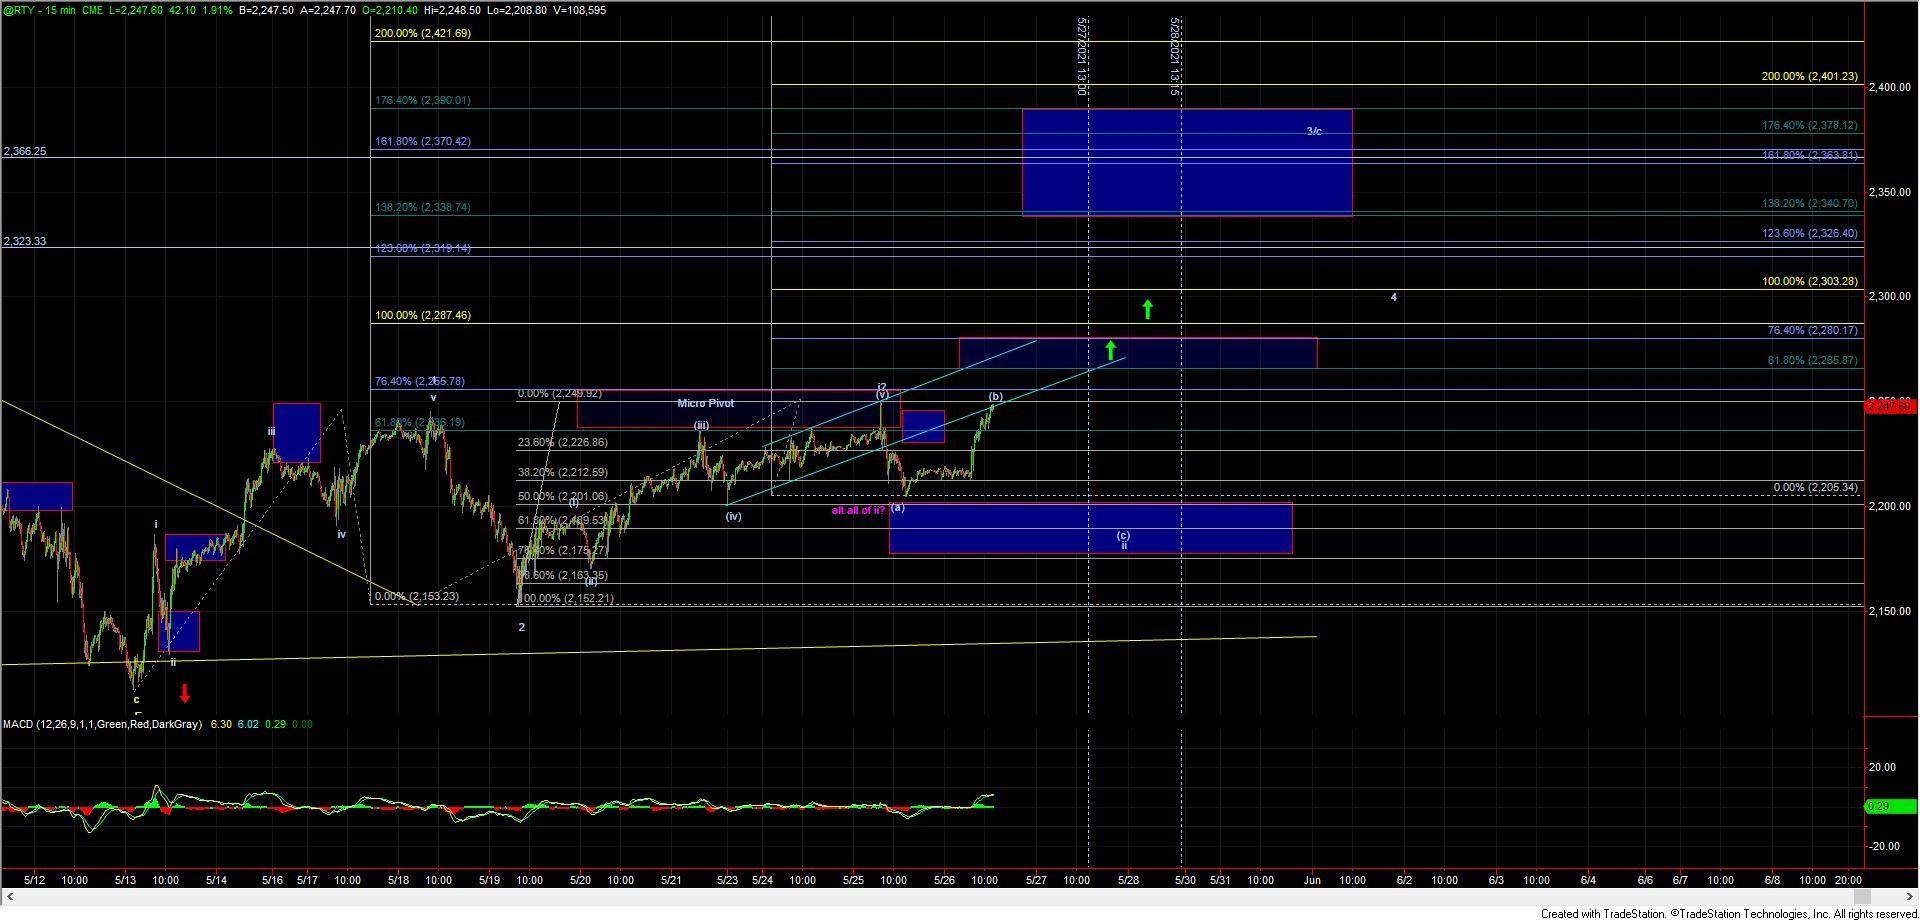
Now with all of that being said, I do want to note the patterns which we are seeing on both the Russell 2000 and the Nasdaq 100 which have potentially more immediately bullish patterns. The Russell 2000 as shown but the RTY chart has a potentially very bullish 1-2 i-ii setup in place. Ideally and to fit best with the SPX/ES pattern the RTY still would see a bit deeper pullback as part of a wave (c) of ii before breaking out higher as shown in white on the RTY chart. If however the RTY breaks out directly over the 2255 level and then through the 2287 level overhead we have the potential for this to see a very explosive move as part of a wave iii of 3 up towards the 2338-2390 zone directly overhead.
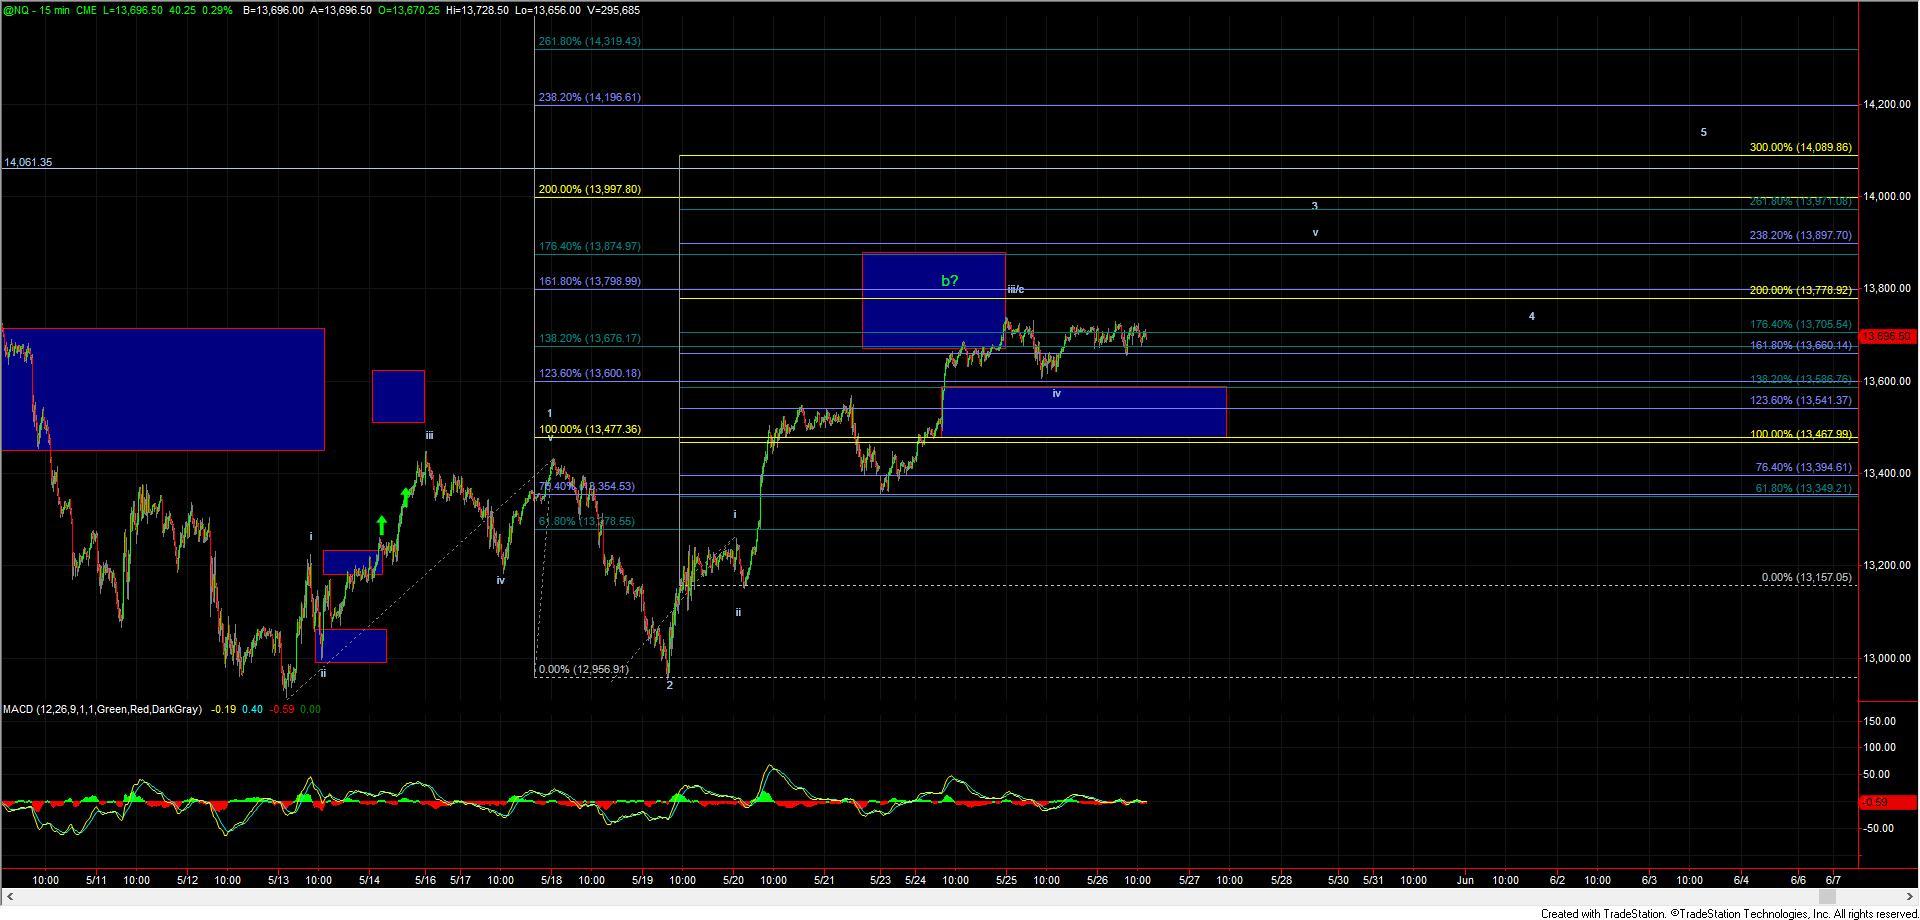
The Nasdaq chart is also setup in a potentially bullish pattern with a possible micro five up off of the 13,600 low as shown on the NQ chart. The Nasdaq is however still likey working off a wave 3 off of the May 13th lows so I would not expect a bit more of a muted move vs. that of the RTY if we do indeed breakout here. With the possible five up off of that 13,600 support level however I can not discount this breaking out to new highs prior to a break of the 13,600 level.
So with these potentially more immediately bullish patterns on the board while the SPX/ES still would look much better with a deeper retrace if we see the ES breakout over the 4216 level then I still do have to allow for the potential for this to be moving directly higher in that wave (iii)/(c) which I am showing in white on the chart. Back below that LOD at 4180 however give us further confirmation that the pullback per the primary green path is indeed underway.