Market Still Bullish Over Support
While the market has maintained over the 2410SPX region, and moved through the resistance noted yesterday at 2436SPX, there are several issues I am seeing at this time.
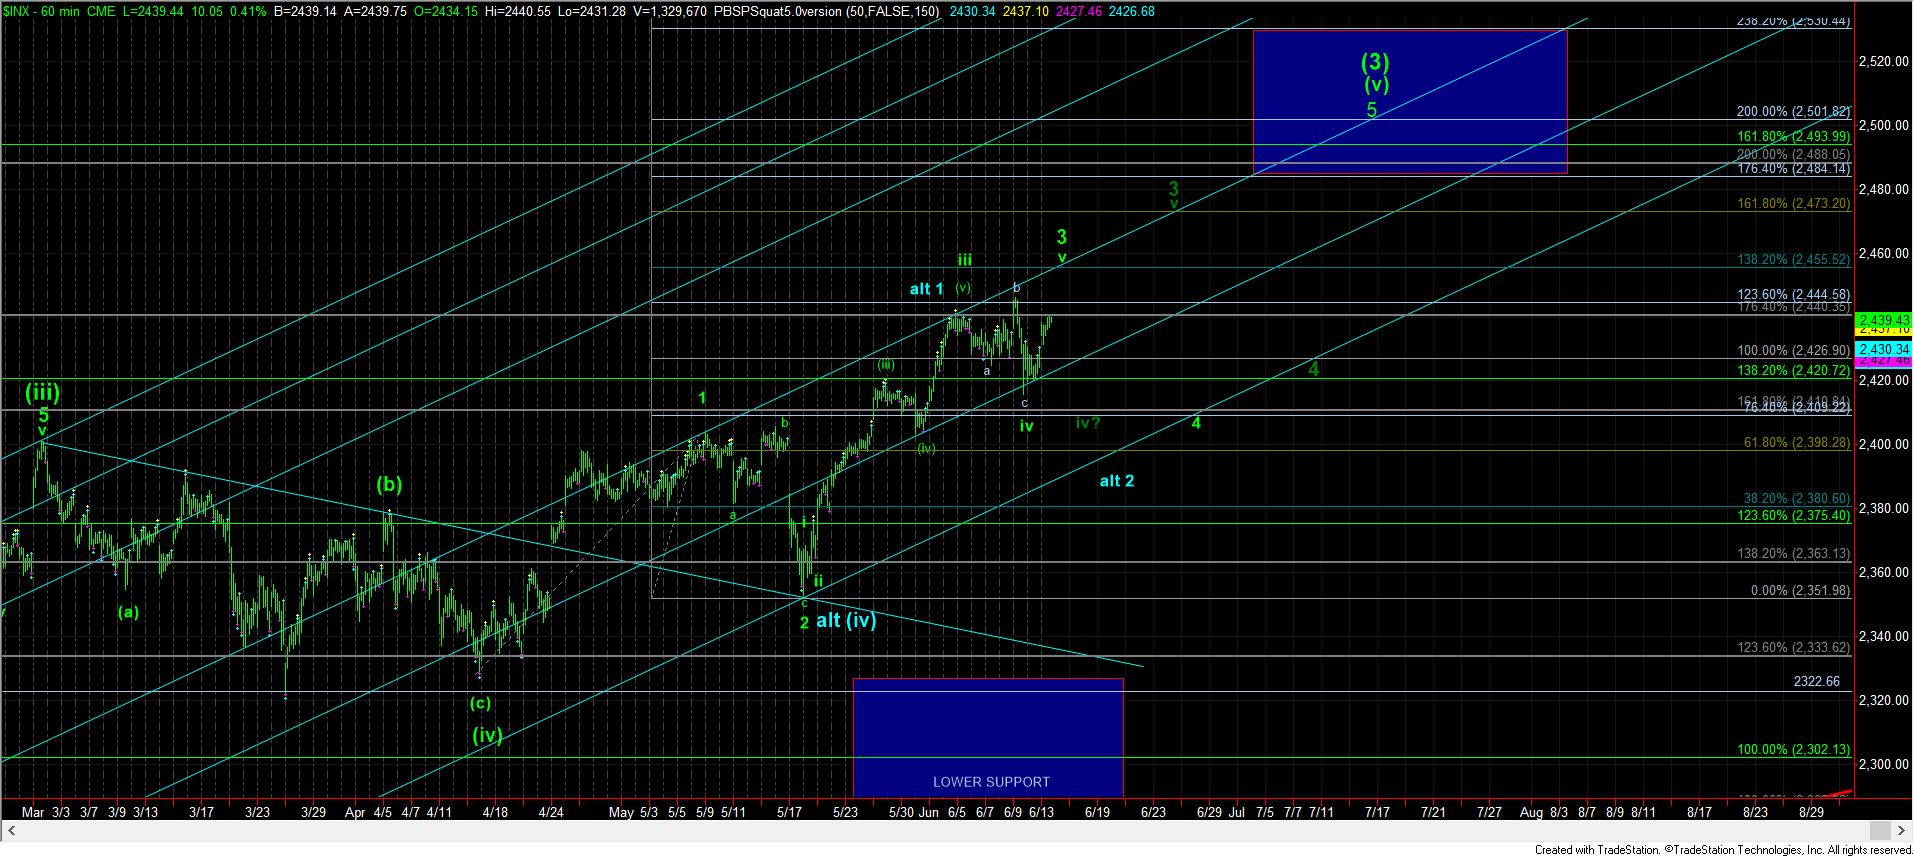
First, if we remain over today’s pullback low seen during market hours (2431SPX/2429ES), the upside in this wave v of 3 in SPX seems as though it may be limited to the 2455SPX region, which is the 1.382 extension, rather than the 2473SPX region at the 1.618 extension. The reason is this move up off the Friday low does not provide us with high standard extension targets, that is, unless we start seeing some MAJOR extensions into tomorrow.
However, if we were to break back below today’s pullback low, then it would suggest this rally was really a b-wave in the wave iv of 3, which is now presented in dark green on the 60-minute chart. That would then open the pattern up to potentially re-setting to head to the 2473SPX more ideal target for wave v of 3. And, while I cannot tell you with certainty which direction the market will chose, I will say that as long as we remain over 2431SPX, I will view us as being in wave v of 3.
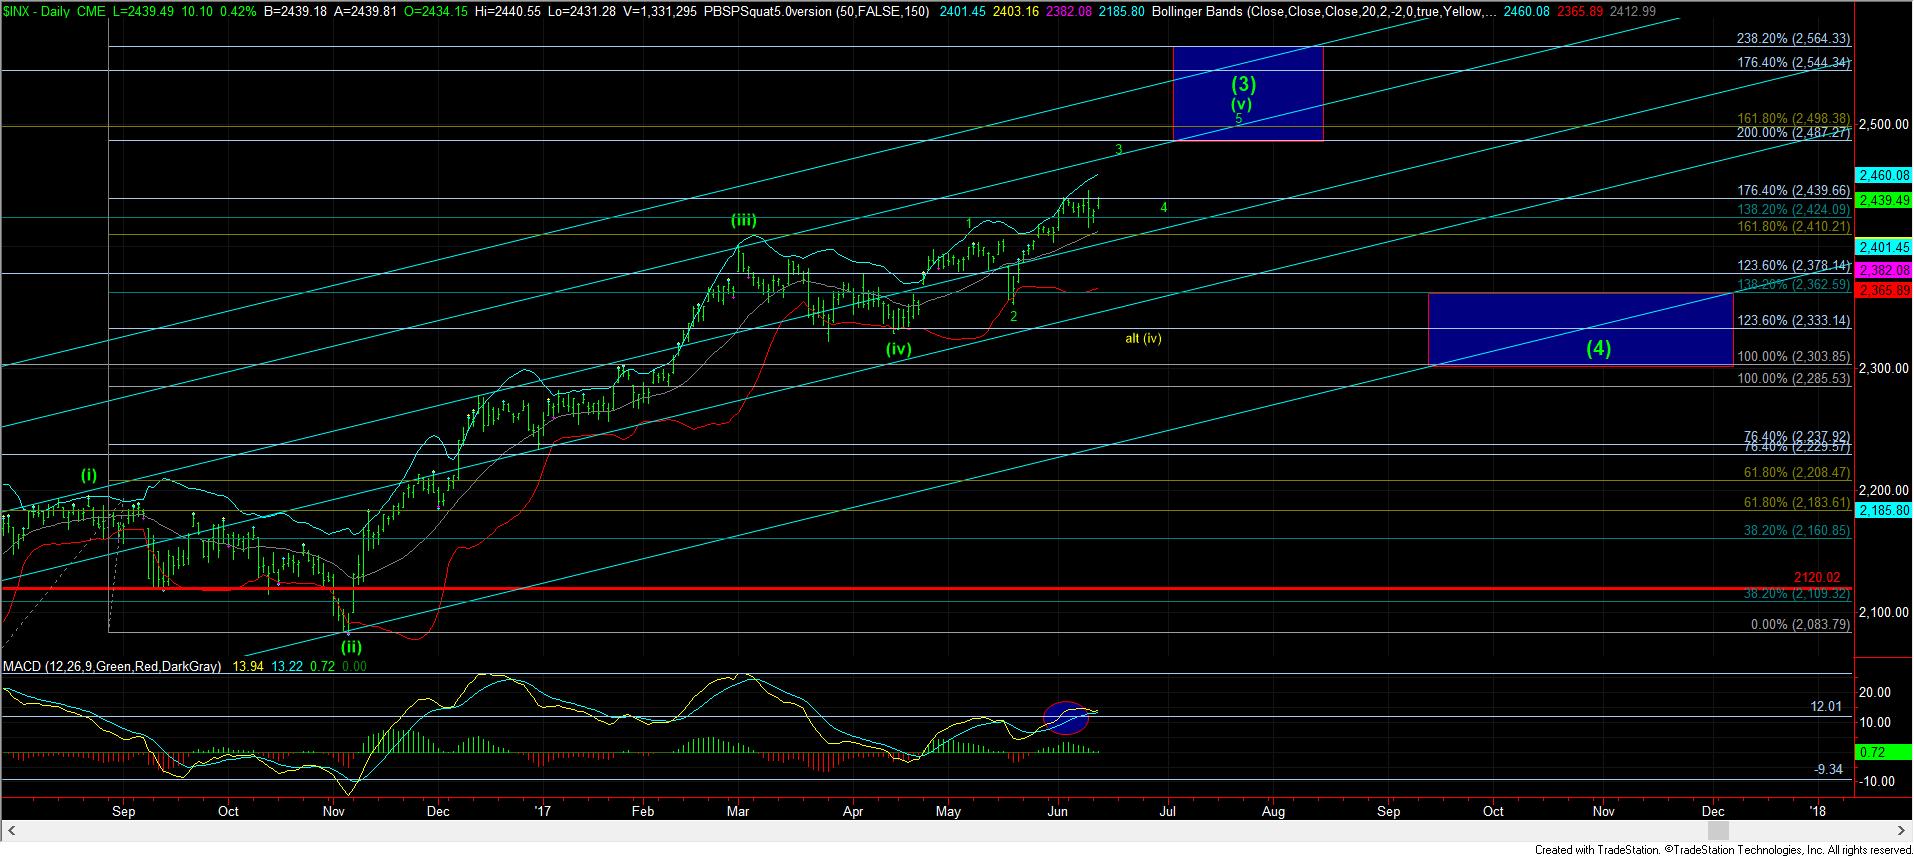
As far as the larger degree pattern is concerned, I am still looking to complete waves 3, 4 and 5 in wave (v) of (3), which has been on our charts for months. How deep we move into that target is yet to be determined, but, in the current bigger structure, 2530SPX was really the ideal target, but the current extensions are not really projecting much beyond 2500SPX.
I also want to note that the main reason I cannot be more certain as to where we stand and the ideal target higher is because of the poor structure we inherited from the wave (iv). The main issue that I cannot be certain where that wave (iv) truly ended, even though I have provided the most likely scenario as I see it on my chart. While we ordinarily will see a solid 5 wave structure down for a c-wave to solidify where the 4th wave completed, we were not blessed with such a clear pattern on the last consolidation, so it does leave some questions in my mind.
Lastly, as you can see on the 60-minute chart, I have added an alternative bullish count. Should we see a sustained break down below 2410SPX, then this becomes a count I will be following quite intently, as it can certainly take us up towards the 2560+ region to complete wave (v) of (3), and generate some exceptionally bullish sentiment just in time to pull the rug out for the drop back down to the 2300SPX region in wave (4). But, under almost all circumstances I can foresee, I still expect a drop back down to the 2300SPX region in wave (4) before we are able to set up for a rally to the 2600SPX region we expect into next year.