Market Stalled At Next Resistance
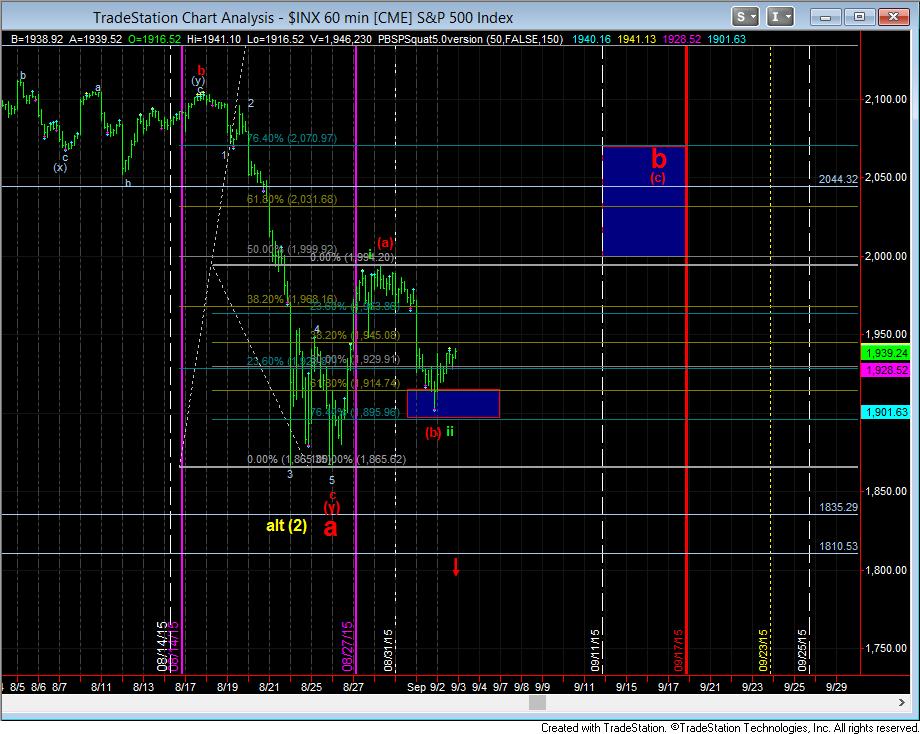
With the amount of damage done to the market with this decline off the all-time highs, there are a lot of resistance regions which will need to be overcome if we are going to move higher, even in a corrective move. While the market held support yesterday, and moved through the 1933SPX zone, we have encountered our next resistance zone at 1940SPX. And, it sure seems like every resistance may turn into a battle.
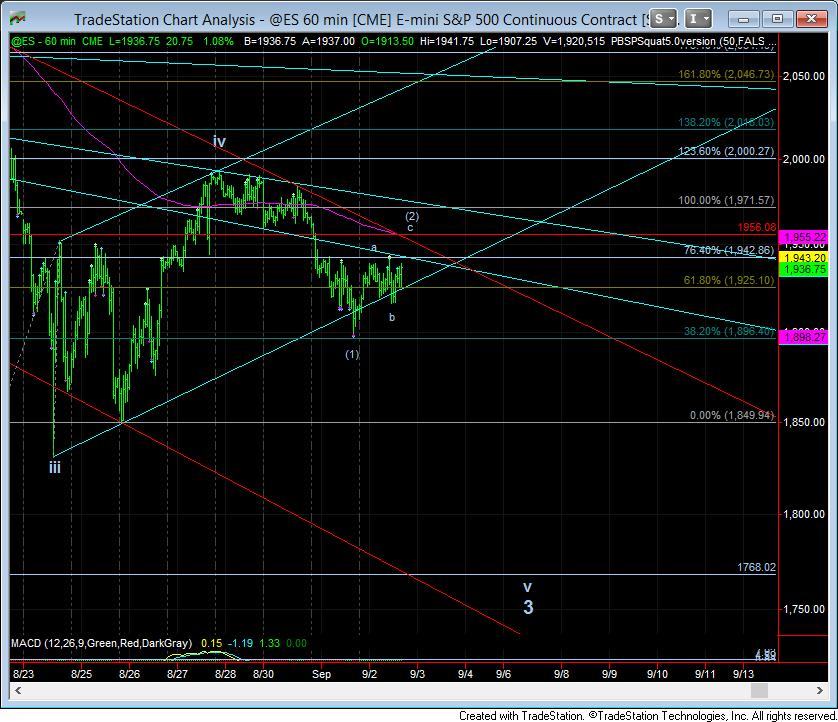
As it currently stands, if the market can continue to move up constructively, then the next resistance region I have noted today was the 1956ES zone, which is where we have an a=c within a potentially bearish count that can take us down to the 1770 region. Again, the market resistances now must be strongly respected as long as we remain below 1995SPX. In the ES, the 1956, 1971, and 1981ES regions will all be strong resistance levels that can turn this market down to lower lows.
Also, I want to reiterate what I posted this morning:
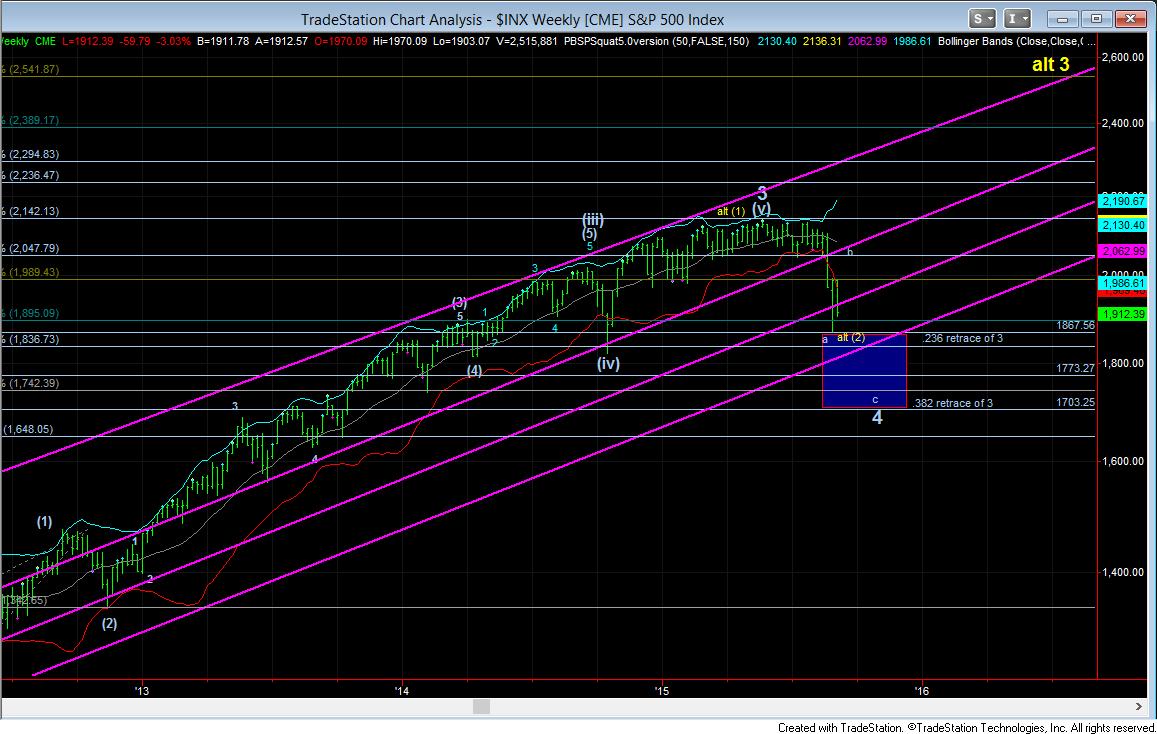
Last night and this morning I was doing more work on the bigger symmetries in the market. Much of what I am coming back with, especially with the market as weak as it is shows that P4 is not likely completed yet. While we certainly have a green count on the table as presented on the 60 minute turn chart, at this time, it is presenting as the least likely path, at least to me. For now, the most likely target for a bigger P4 is the 1705-1740SPX region.
Due to the serious weakness we have been seeing of late, I have been asked what is my most bearish count right now, and it is presented on the 60 minute ES chart. This suggests that the last low was only wave iii of 3 in the c-wave of P4. Even if the market rallies, but does so in a 5 wave move to the 1960ES region, and then falls back below the 1944ES region impulsively, it would open the door to a drop towards the 1770ES region to complete wave v of 3. Again, this is my most bearish count right now, as long as we are unable to move through 1960ES.
But, I have to note that my primary pattern is still alive and well, and expecting a bigger b-wave rally. The only issue I have with it is timing, as it seems like there is too much time on the clock for a (c) wave, as presented on the 60 minute chart, especially based upon how fast the market has been moving. But, remember, that pattern still suggests that the lows have not yet been seen as well.
So as the market progresses, we will attempt to look for more clues as to how the market drops to lower levels to complete P4, but the action we are seeing of late is making it a lot less likely that it has completed.
But, as always, I am going to remain open to the very bullish count which has us already completing this downside, and heading to new highs. It does not mean I intend to trade that perspective until the market proves itself. But, again, we have plenty of time and room for the market to prove that potential as the targets are in the 2400 region, or even higher.
Until that proof is seen, my focus is going to be on where the next larger turn down will occur. And, ideally, I would like to see a much bigger rally set up the next bigger decline.