Market Stalemate - Market Analysis for Oct 3rd, 2018
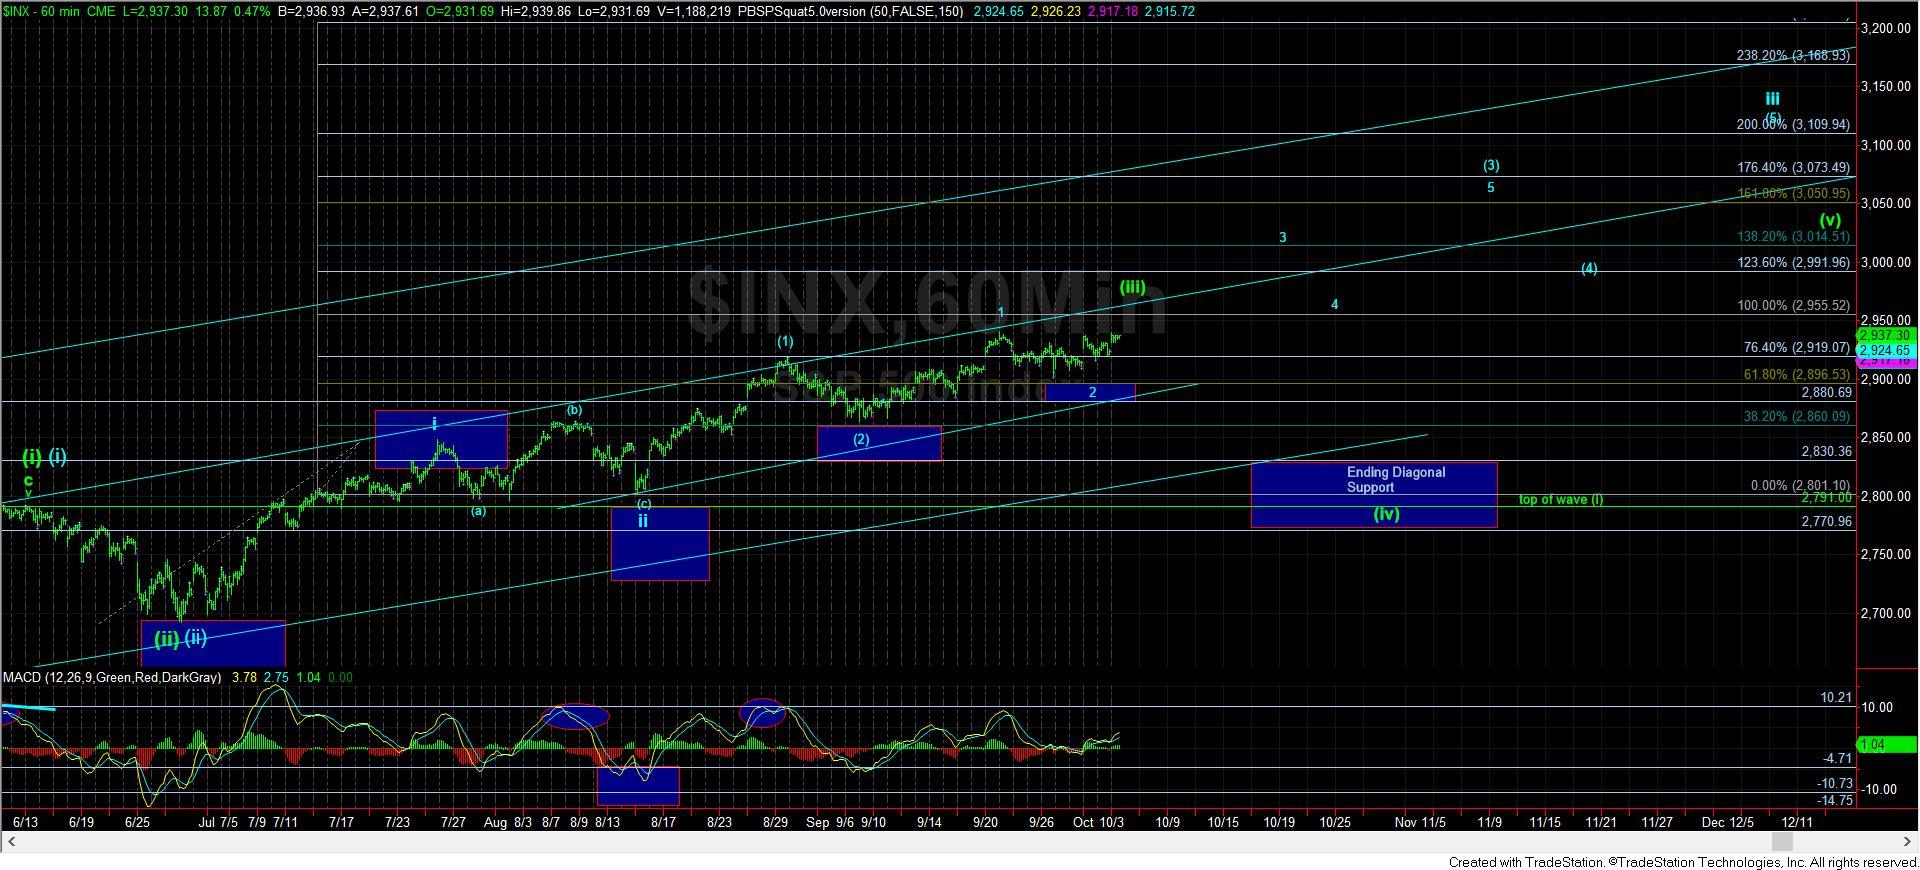
The market has approached the 2940SPX resistance many times over the last week, but has thus far refused to break through. While I still expect the market to exceed that level, the structure of the recent move off support has not given me the warm and fuzzy feeling I would want to suggest that 3200+ is in our near-term future. Rather, the overlapping nature of the structure seems to be more indicative of the ending diagonal pattern presented in green if we are to see a direct break out as early as tomorrow.
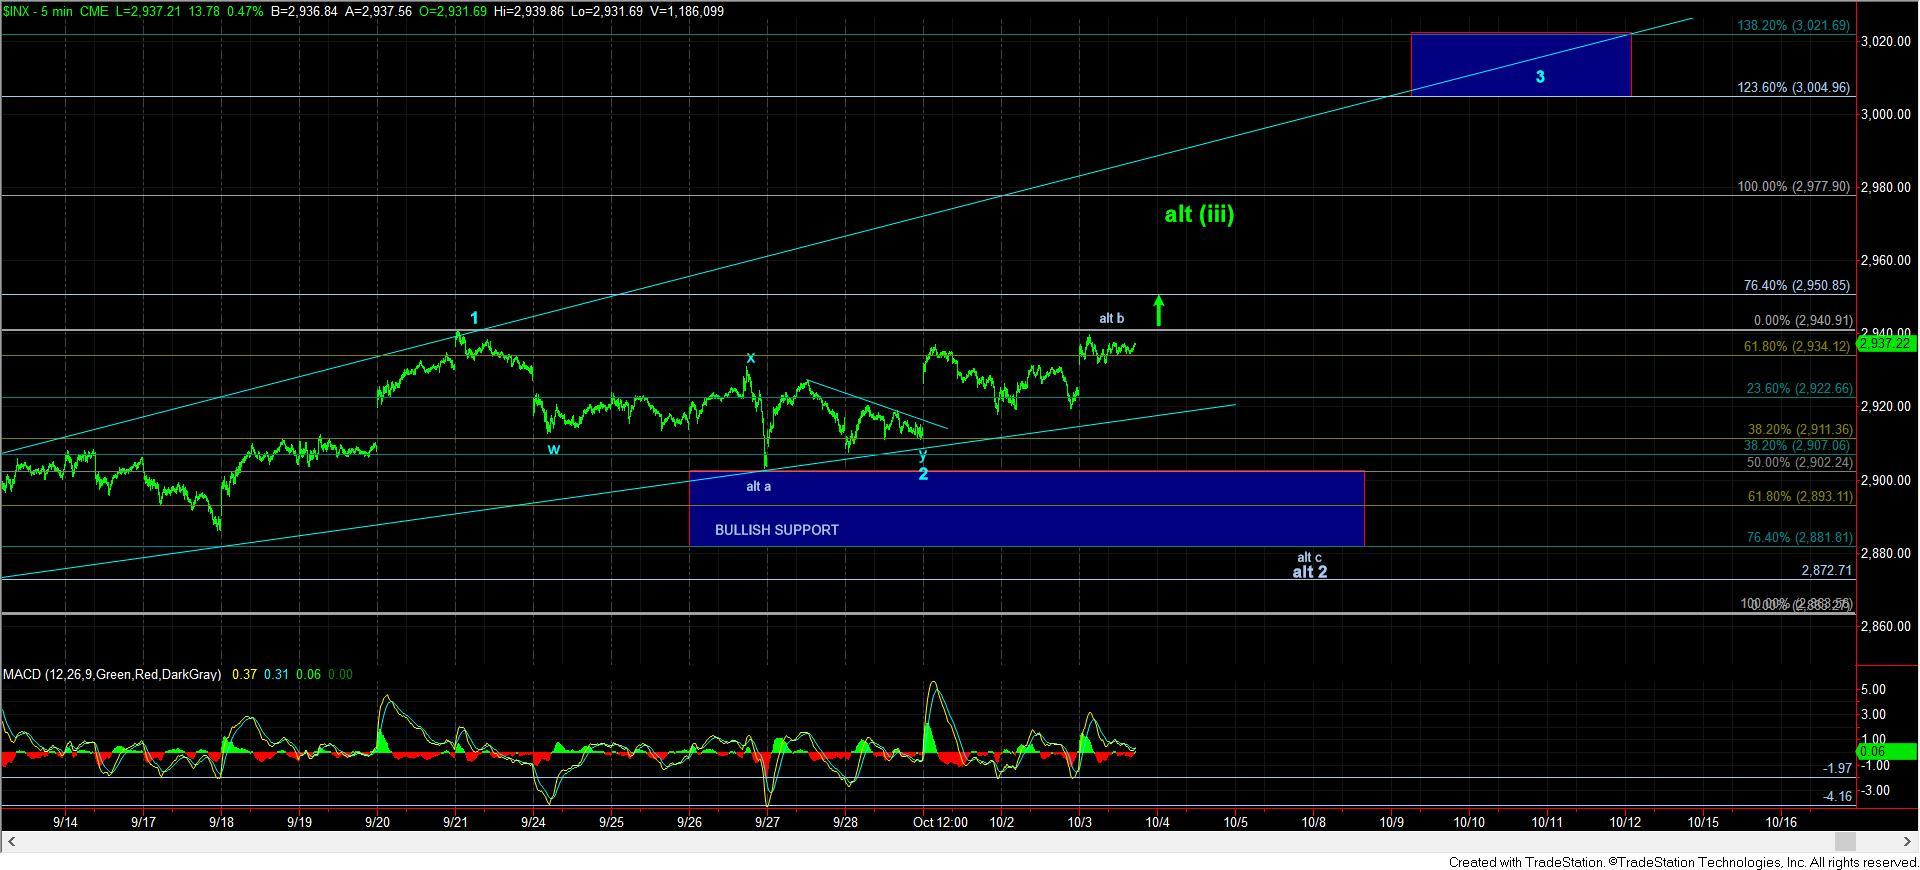
What is interesting about the current micro structure is that as long as we hold 2920SPX right now, we have an immediate set up to break out towards 2950+. And, should the market then break back below 2920SPX from the 2950+ region, that would confirm the ending diagonal scenario for me as my primary pattern.
But, until such time that we actually get that break out through 2940SPX, the bigger wave 2 is still just hanging on by the skin of its teeth. Yet, until we see a break down below 2920SPX, I have to view that potential as my alternative at this time.
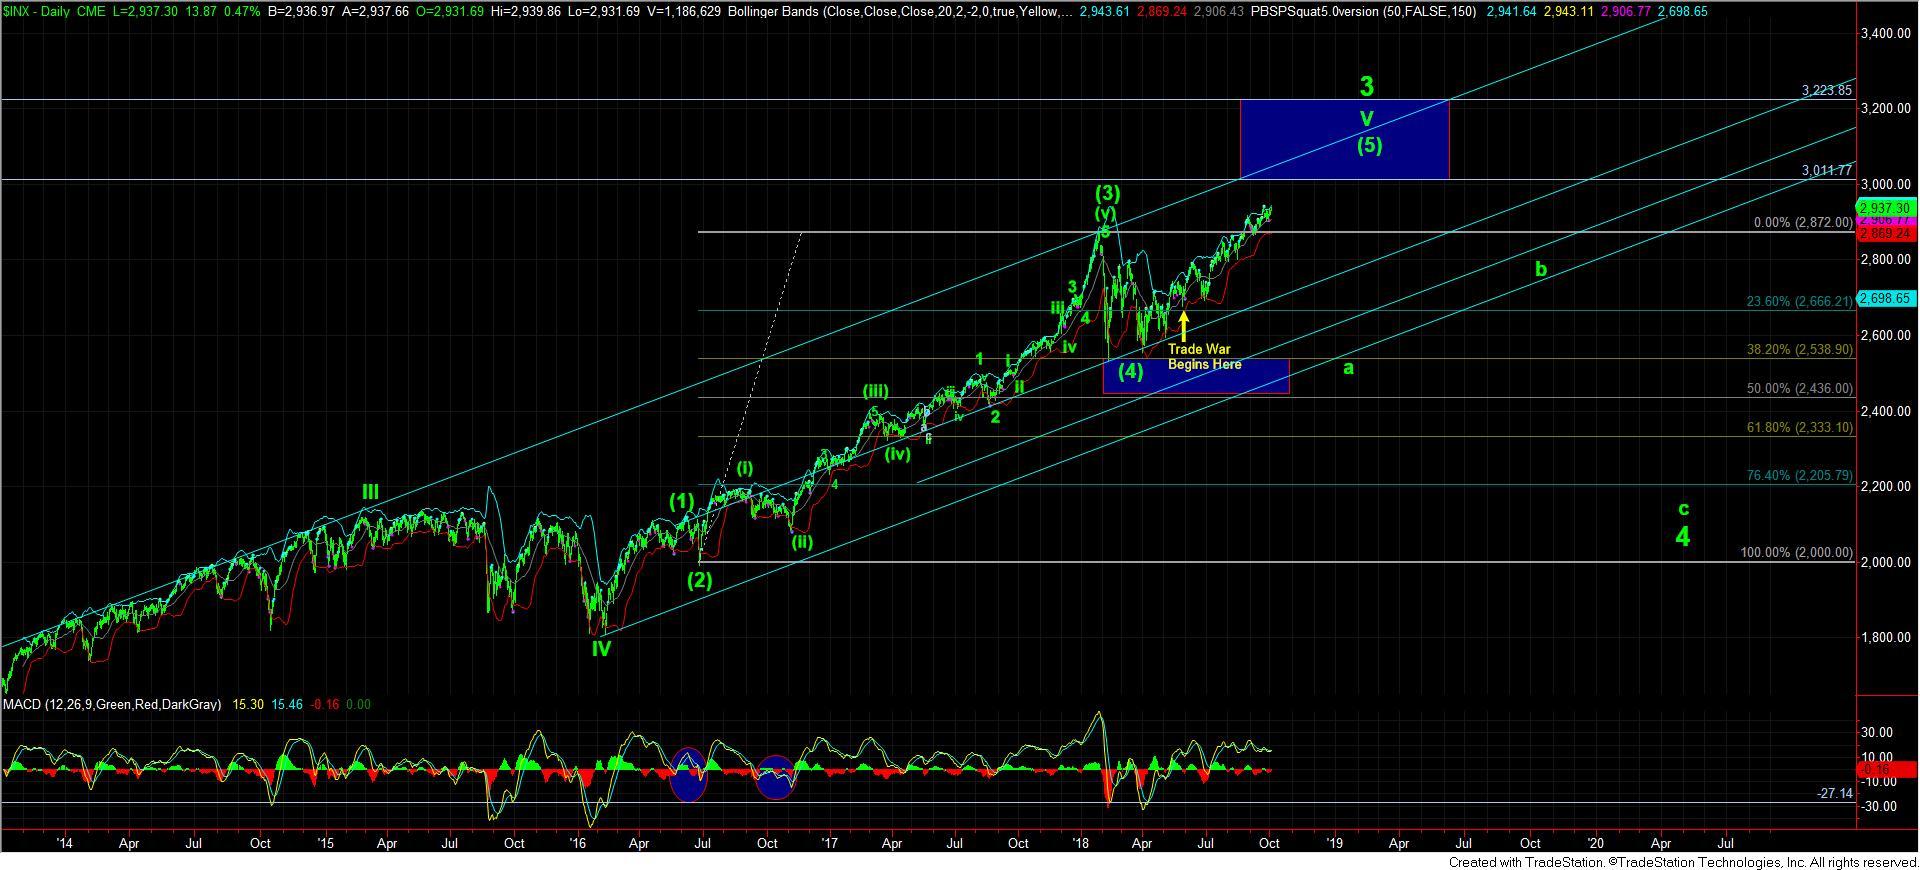
So, as we head into the second half of the week, the market parameters remain the same. As long as we hold over 2880SPX, the 3225SPX target remains on our charts. However, if we were to directly break below 2880SPX from here, or if we were to break out to 2950+, and then break back below 2920/30SPX, that places me squarely in the ending diagonal scenario. Yes, indeed, the market is still going to have to thread this needle if it is looking to target the 3200+ region before we complete wave 3 off the 2009 lows, and time and room are both running out.