Market Sitting At Key Inflection Point
 By
By
Today, the market continued to decline, breaking through the upper end of the micro pivot I previously identified on the charts. However, we are still above the lower end of this pivot, which needs to be breached to confirm the more immediate path lower. We are still significantly below key overhead resistance, so as long as this resistance holds, the near-term pressure will continue to be downward.
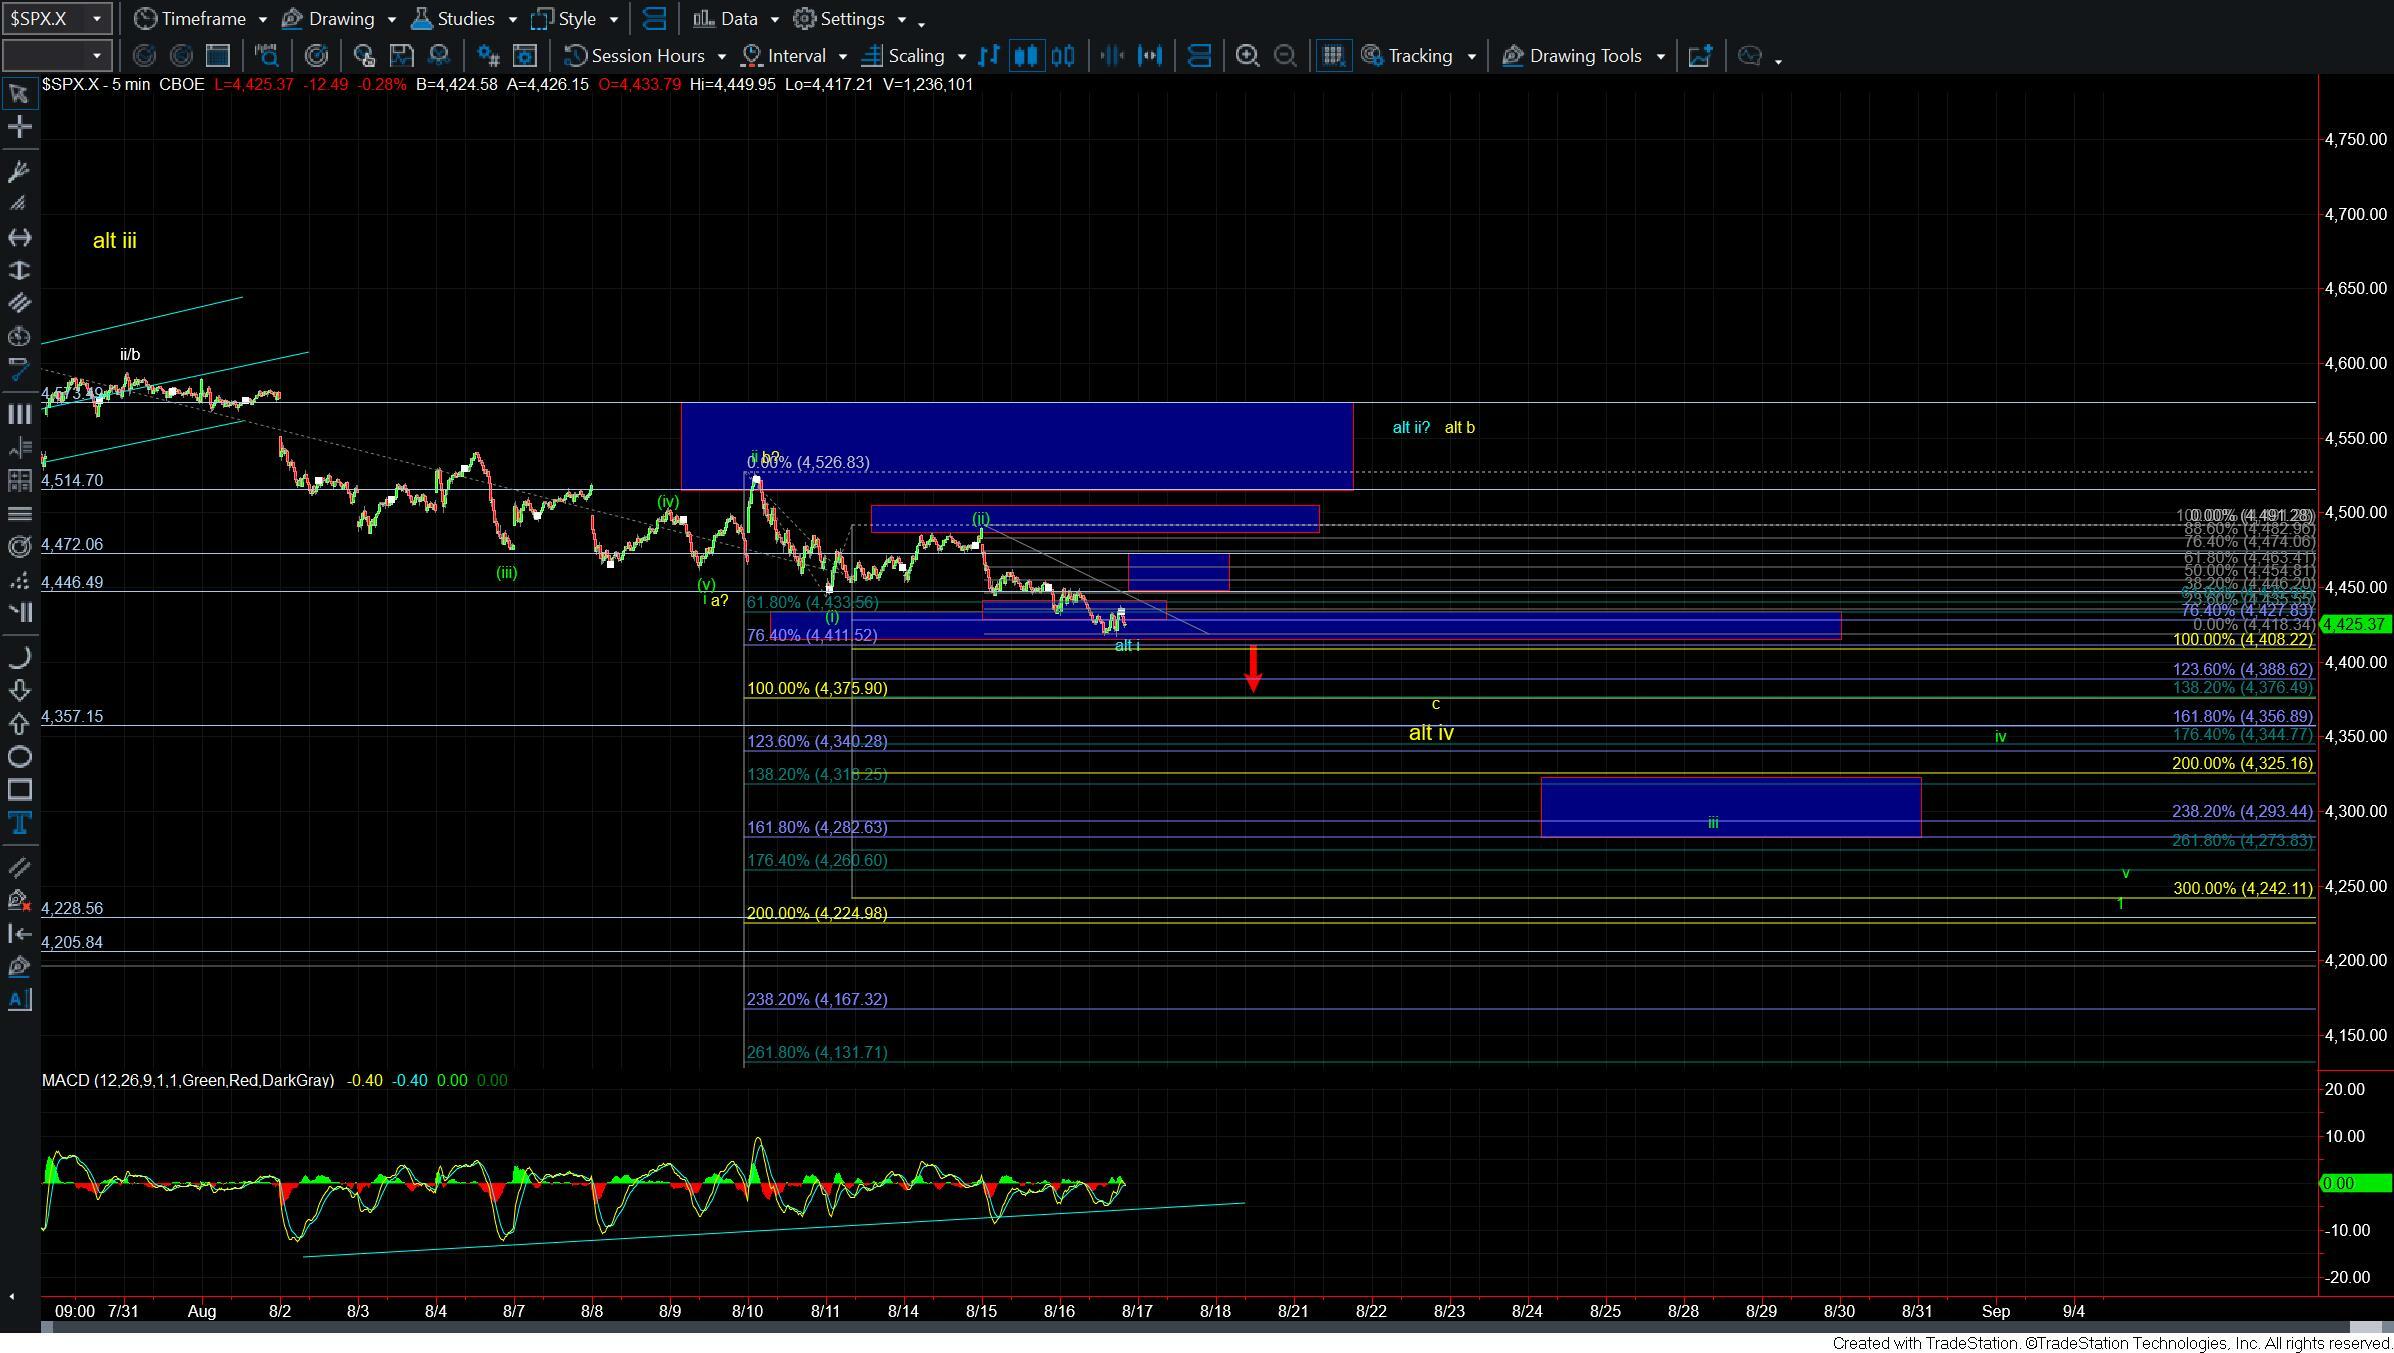
As shown on my 5-minute chart, the market stopped just shy of the 76.4% extension of the wave i down at the 4411 level. Breaking through this level would pave the way for a more direct move down to around the 4375 level. This level represents the 100% extension of the initial drop from the highs, and breaking it would provide further evidence that we're following the green count rather than the yellow path. If we do manage to break the 4375 level, the next target range for wave iii of the larger wave 1 would be 4325-4282, with the ultimate wave v of 1 target closer to the 4260-4224 zone.
The current overhead resistance lies in the 4446-4472 zone. As long as we stay below this zone, the near-term pressure will remain down. If we break over this zone and subsequently break the 4491 level, it would signal a potential move towards a larger wave ii up, following the blue count.
At present, the market structure leans more towards an immediate downward break in the SPX. Similarly, the pattern in the RTY supports a more immediate drop. As long as we remain below the resistance, I expect a near-term decline. The current structure is far from the ideal pattern, so I will remain vigilant and closely monitor the price levels indicated on the charts as we move into the end of the week.