Market Signals A Local Top Has Been Struck But Still Has Support Below To Confirm A Larger Top
 By
By
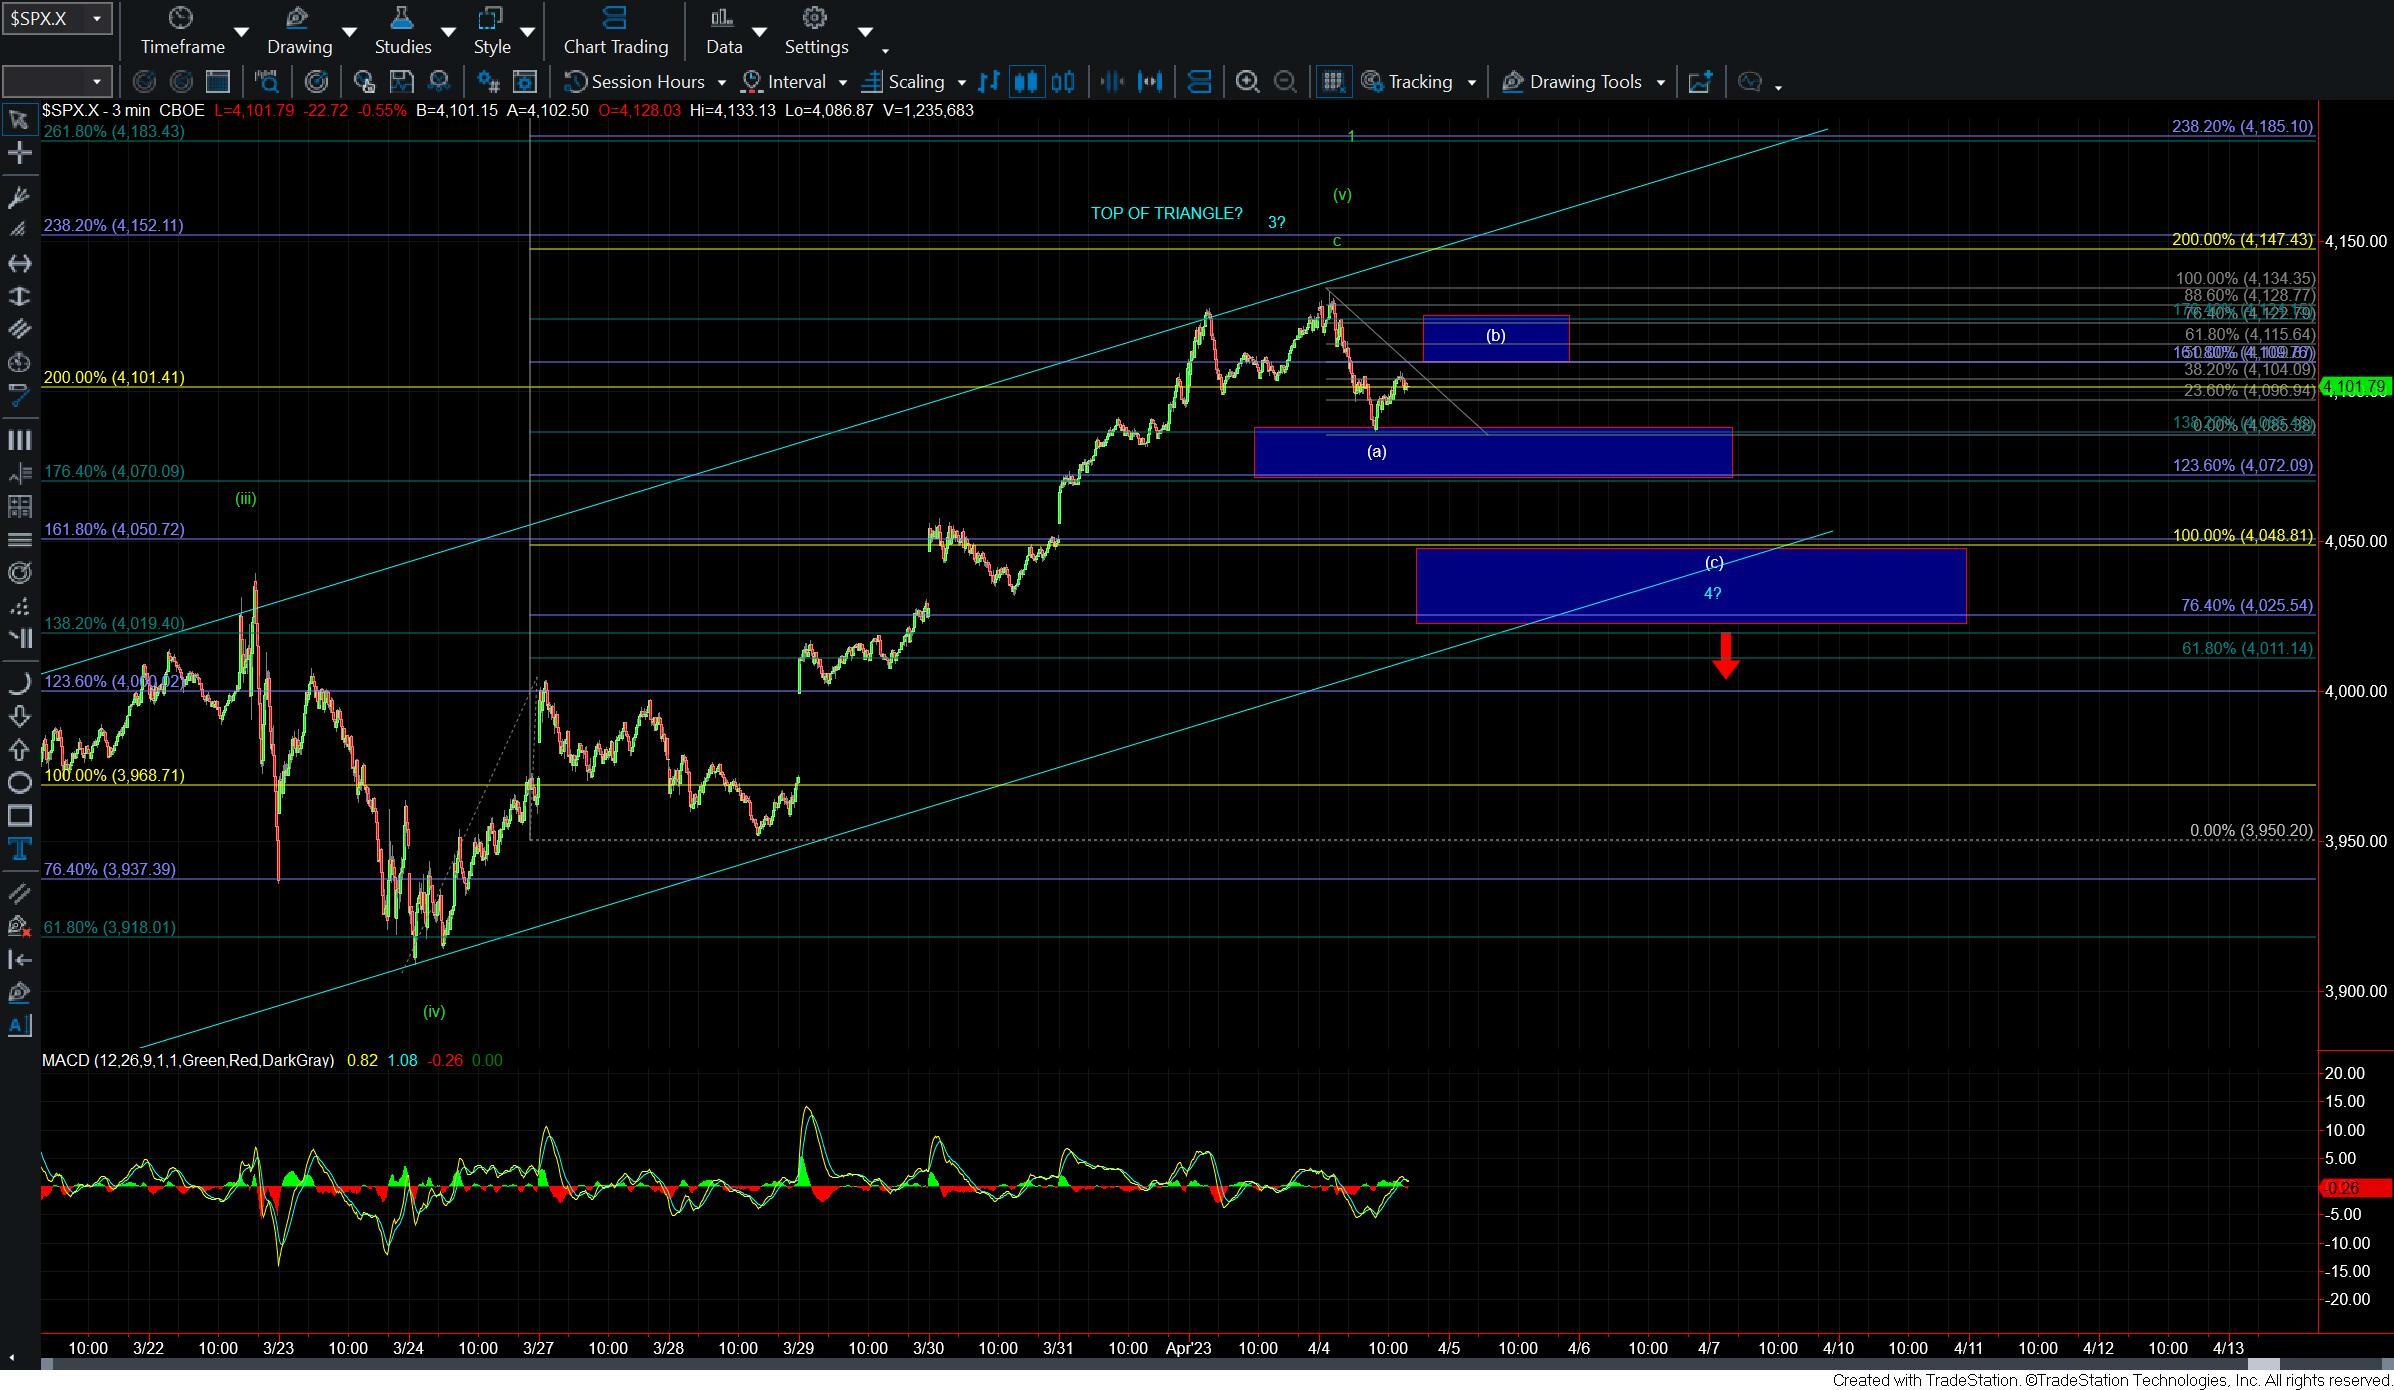
Today the market opened slightly higher only to see those highs rejected in the early morning session with what can be counted as a five-wave move to the downside. We have found support just over the upper support zone at the 4086-4072 zone but with what I can count as five down, The structure of the MACD on the 60min chart, and the action I am seeing on the Russell 2000 my base case is that we have put in at least a local top at today's high.
The bigger question that I have is whether that high is the top of the green wave 1 or the blue wave 3. In either case, however, I do think that we still are likely to see this move lower over the next few trading sessions. How we react at the next key support zone below should tell us how deep this retrace is likely to be before finding a bottom.
The bigger picture there still is no significant change and we are watching both the green and the blue counts. The green count is suggestive that we are topping in a larger wave 1 of (c) of b. This path would suggest that we saw a wave (b) bottom at the 3/13 low and we have now begun the wave (c) of that b up. The wave 2 retrace under this case should move us back down towards the 3970-3879 zone before turning back higher again for the wave 3 of (c) of b. We do however still need to break down below the 4086-4072 zone to signal that the wave 2 is indeed underway.
If we hold over that 4086-4072 zone and turn back higher on five waves then it would signal that we may still see another higher high to finish off the wave 5 of c under the blue triangle count. If we do see another higher high under that triangle count we should then hold under the 4201 level and then turn back lower as part of the wave e of (b) for that count. That wave e would likey see a deeper retrace that green wave 2 taking us down toward the 3980-3840 region and testing the lower triangle trend line before finding a bottom. We do still, of course, have a lot of support between there and here so for now I am taking this one step at a time and keeping a close eye on the support levels noted above to help give us near-term guidance over the next several trading sessions.
While we do have the initial signal that we have topped there are still several levels of smaller degree support that need to break to give us final confirmation of a top. Once those levels are broken the next leg to the downside should take us some time to complete whether we are following the triangle count or topping in the larger wave 1.