Market Showing Mixed Signals, But Still Over Support For Now
 By
By
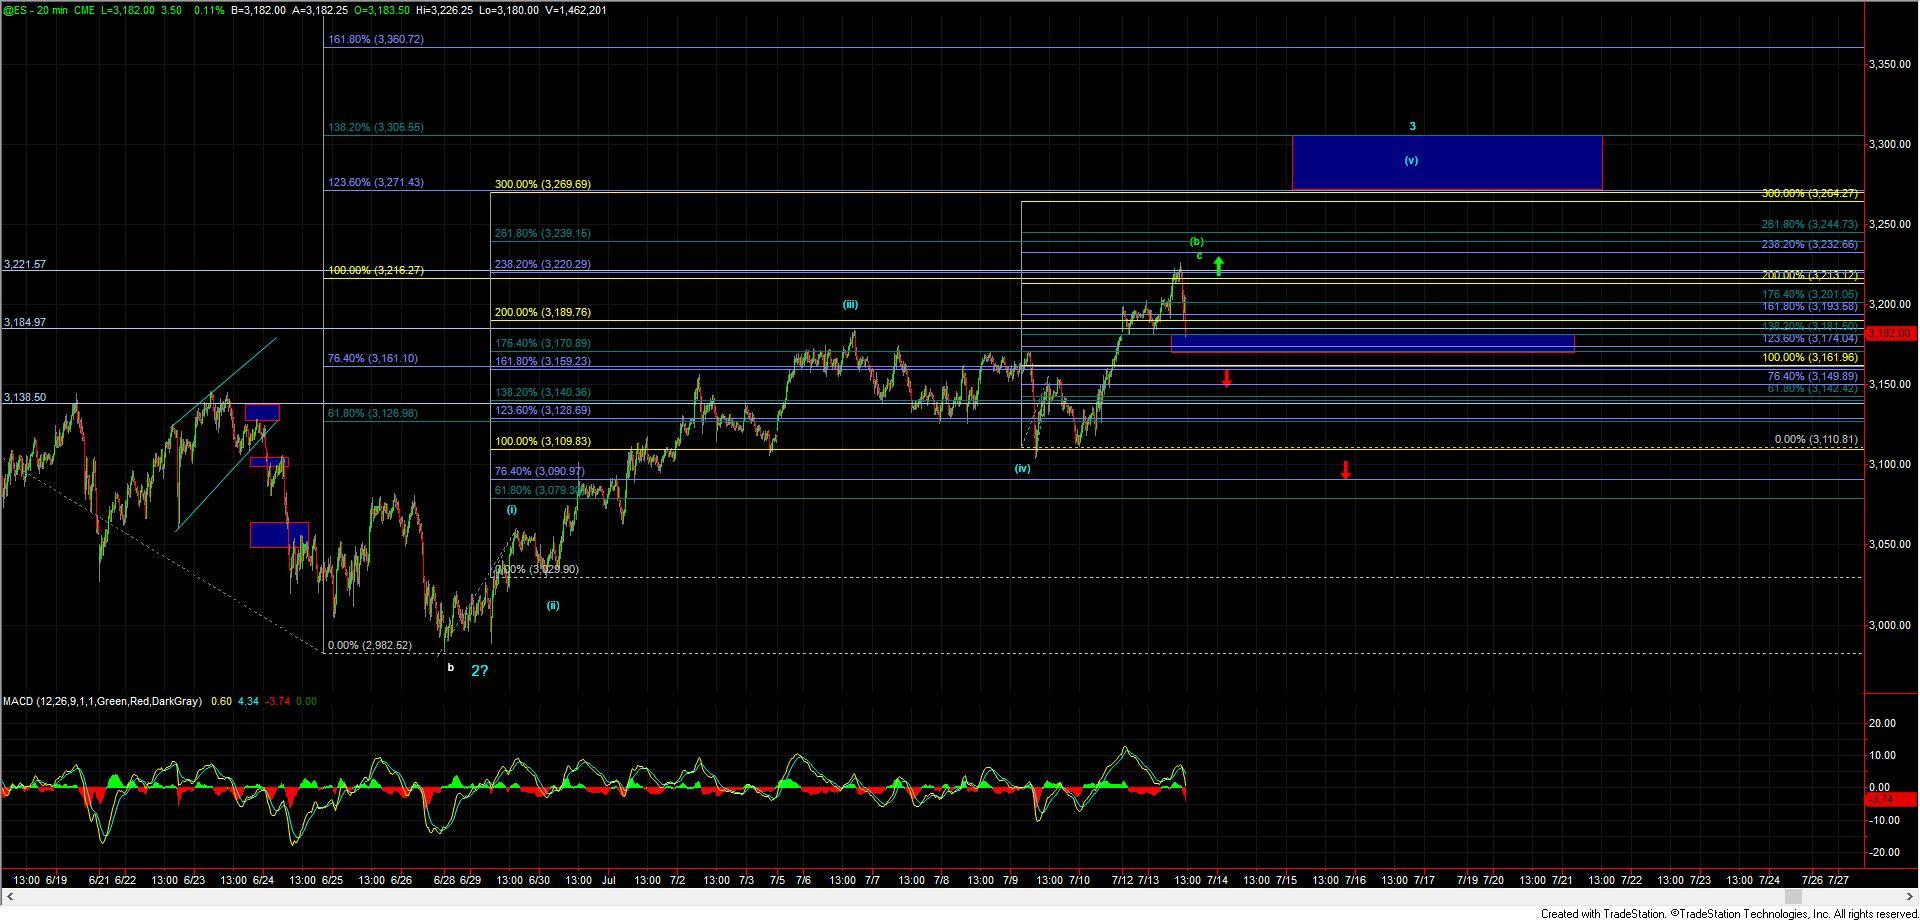
Today the S&P 500 (SPX) and Nasdaq 100 (NDX) both broke higher in the early session while the Russell 2000 (RUT) seemed to lag the early strength in those indexes. Furthermore, we saw some significant divergence form with the VXX also trading higher along with the index charts. Finally, in the afternoon session we began to see some weakness form in the index charts as they all saw some fairly sharp drops off of their highs. That drop down so far has held over even the micro support levels laid out on the ES charts ,which is currently coming in at the 3181-3174 zone.
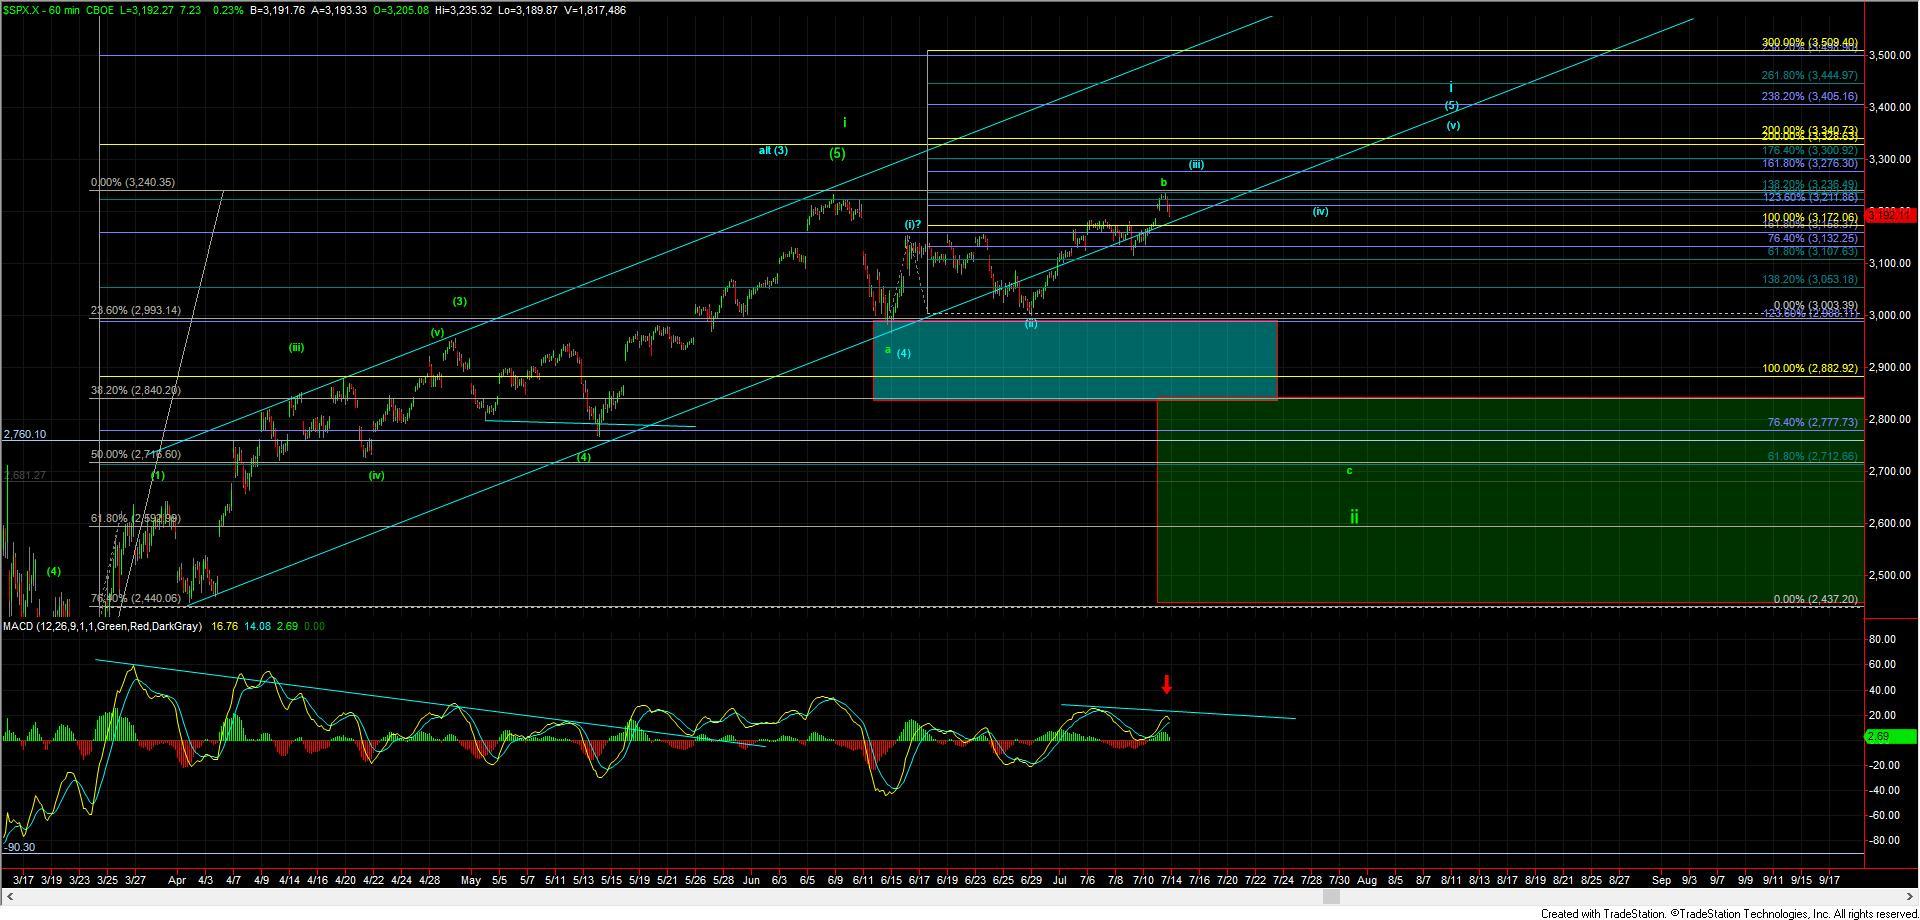
Should the market be able to hold over this support zone, then the blue path still remains in tact even from the most micro of levels. Should we see a break of this 3174 level on the ES, then I would view this as a very early warning sign that the green count may be taking hold. I would still want to see further confirmation of this top with a break of the 3161 level and then below 3128.
So while the market has yet to fully show its hand here, we are closing in on some fairly key support levels that should help give us a good idea of the direction that this will take over the course of the next several weeks.