Market Should Tip Its Hand Soon
With the market breaking down below upper support yesterday, it has done a bit of technical damage to the uptrend we were tracking. However, as I explained yesterday, I still do not have a CLEARLY defined and completed topping structure in place for the b-wave, which forces me to continue to track that potential until we complete 5 waves down.
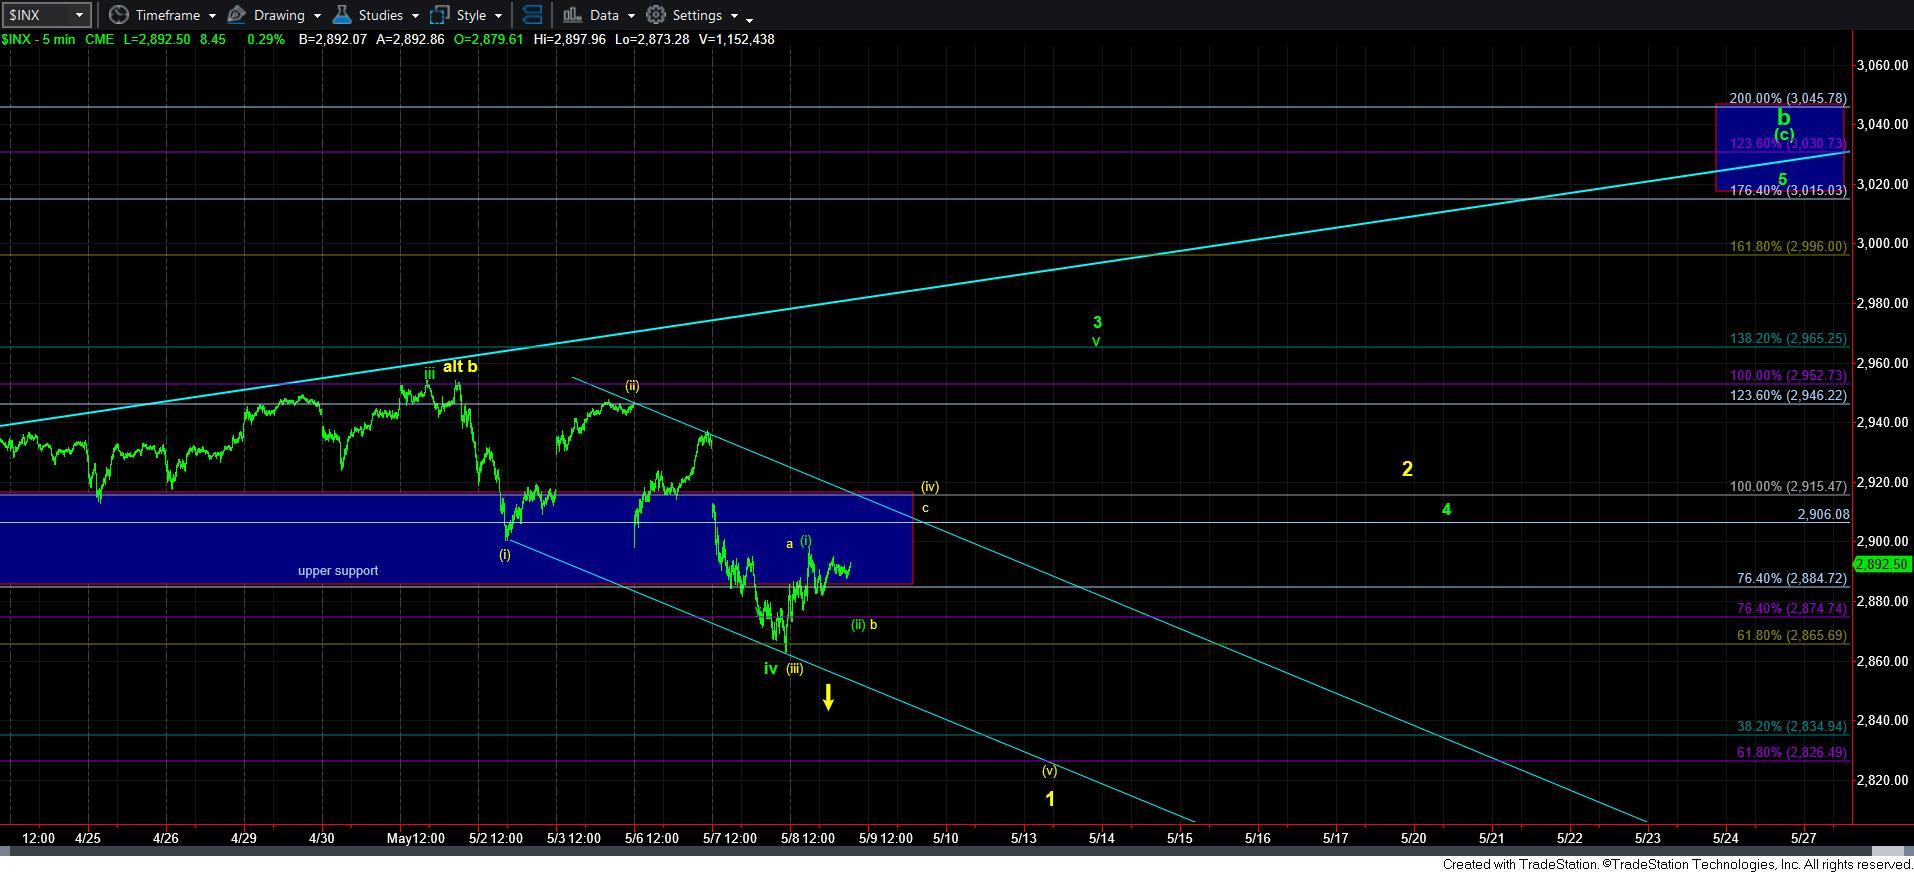
So, if you look at the attached 5-minute chart, I have now placed both potentials on the chart, and, for now, it seems the market will be resolved with how it handles the 2906-15SPX region.
In fact, no matter which path the market takes, it would seem as though both are pointing to 2906-15SPX as a region will likely be revisiting several times over the coming weeks.
In the yellow count, we will likely remain below that resistance, drop to complete wave [v] of 1 off the recent highs in a leading diagonal down, and then likely come back to that region for a wave 2 retracement, and may even exceed it a bit, as retracements of diagonals are often quite deep.
In the green count, we will likely revisit the 2906-15SPX region in a wave 4 of the [c] wave.
So, I don’t think we will get any escape velocity developed for several weeks, as the market will likely continue to region within this general region as its sets up its next bigger move towards 3000+ or as it sets up its 1-2 downside structure.
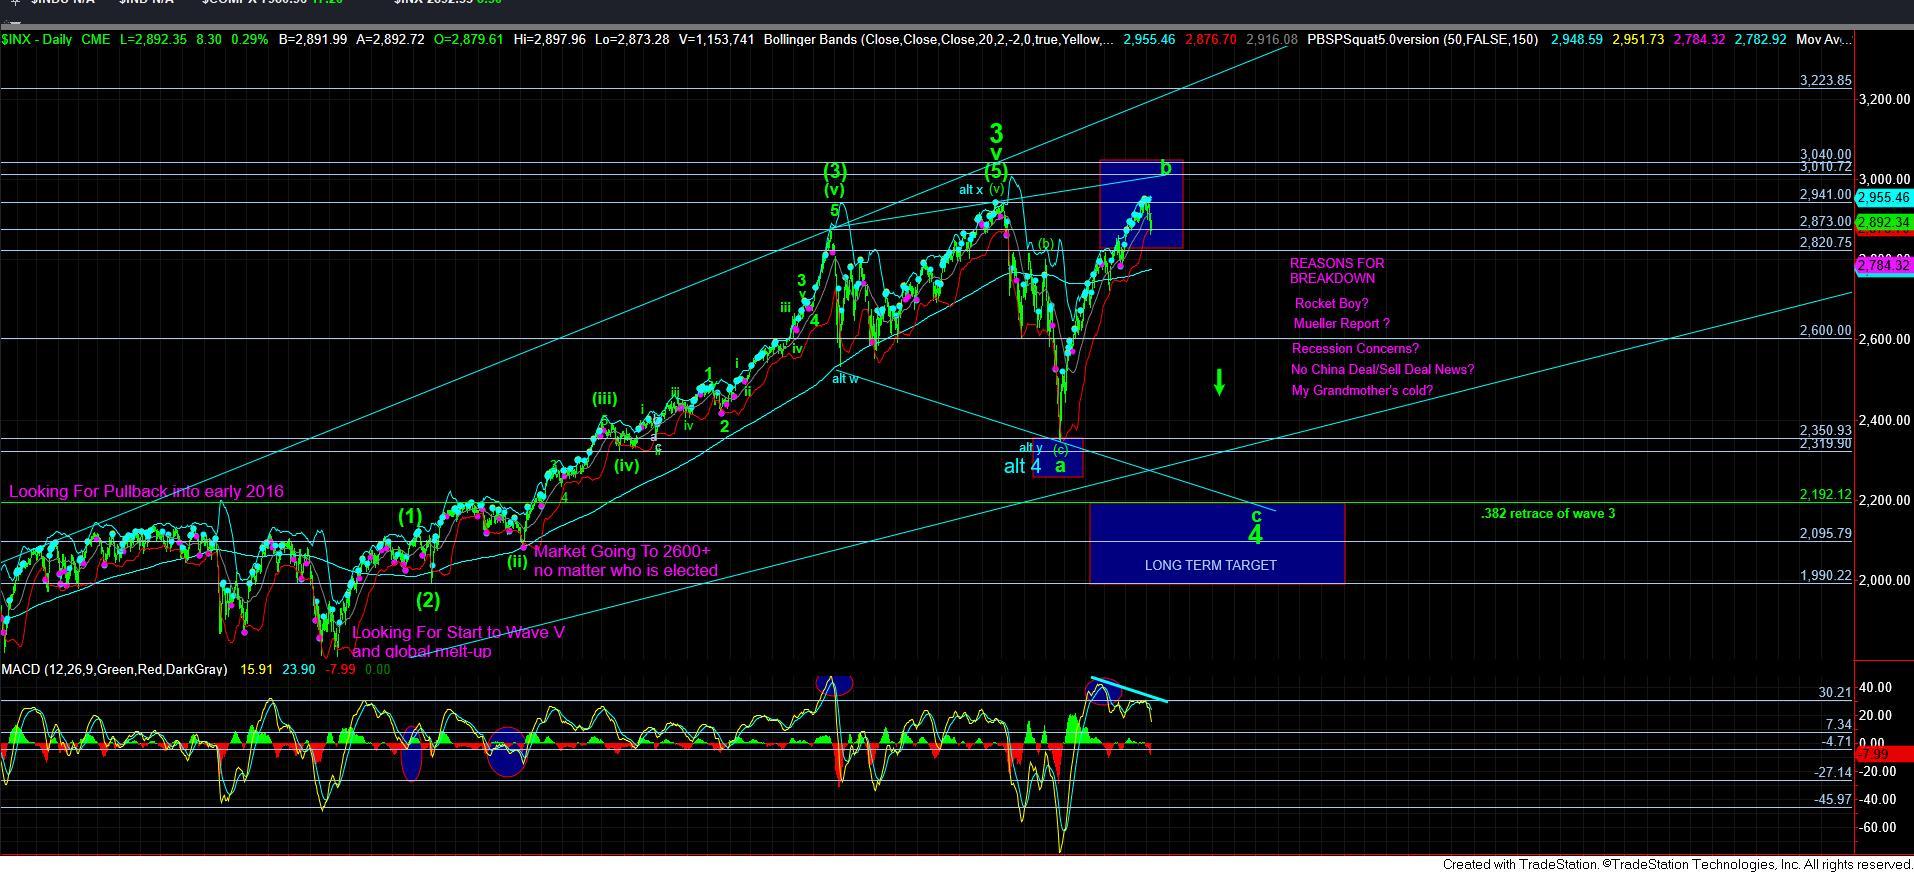
The main ultimate point is that the market is still deciding if it has topped in its b-wave rally, or if it still has a bit of strength left to take us to the 3000 region. Either way, the divergences on the daily chart will not likely subside, which still point to us as either having topped or have just one more push higher to the 3011-45 region. Either way, the risks have now clearly risen.