Market Sees Further Upside Follow-Through
 By
By
Today the market continued to push higher giving us further confirmation that we have indeed put in a bottom in the equity markets. We still have a bit of a question as to which path we are going to take higher and we still are waiting for the rally off of the lows to fill out a bit more to allow us to make the determination. We can lay out some parameters to watch out for however until we see the structure develop a bit more we still will allow for both paths to take shape.
I do want to note that we have done away with the blue count. The primary - bearish - is the green count, and the alternative - bullish - is now yellow. Please see the weekend update for more in regard to why the primary is now the green bearish count as well as why we will not hesitate to move back into the alternative yellow if we see signs that the next leg down after retracing is clearly corrective in nature.
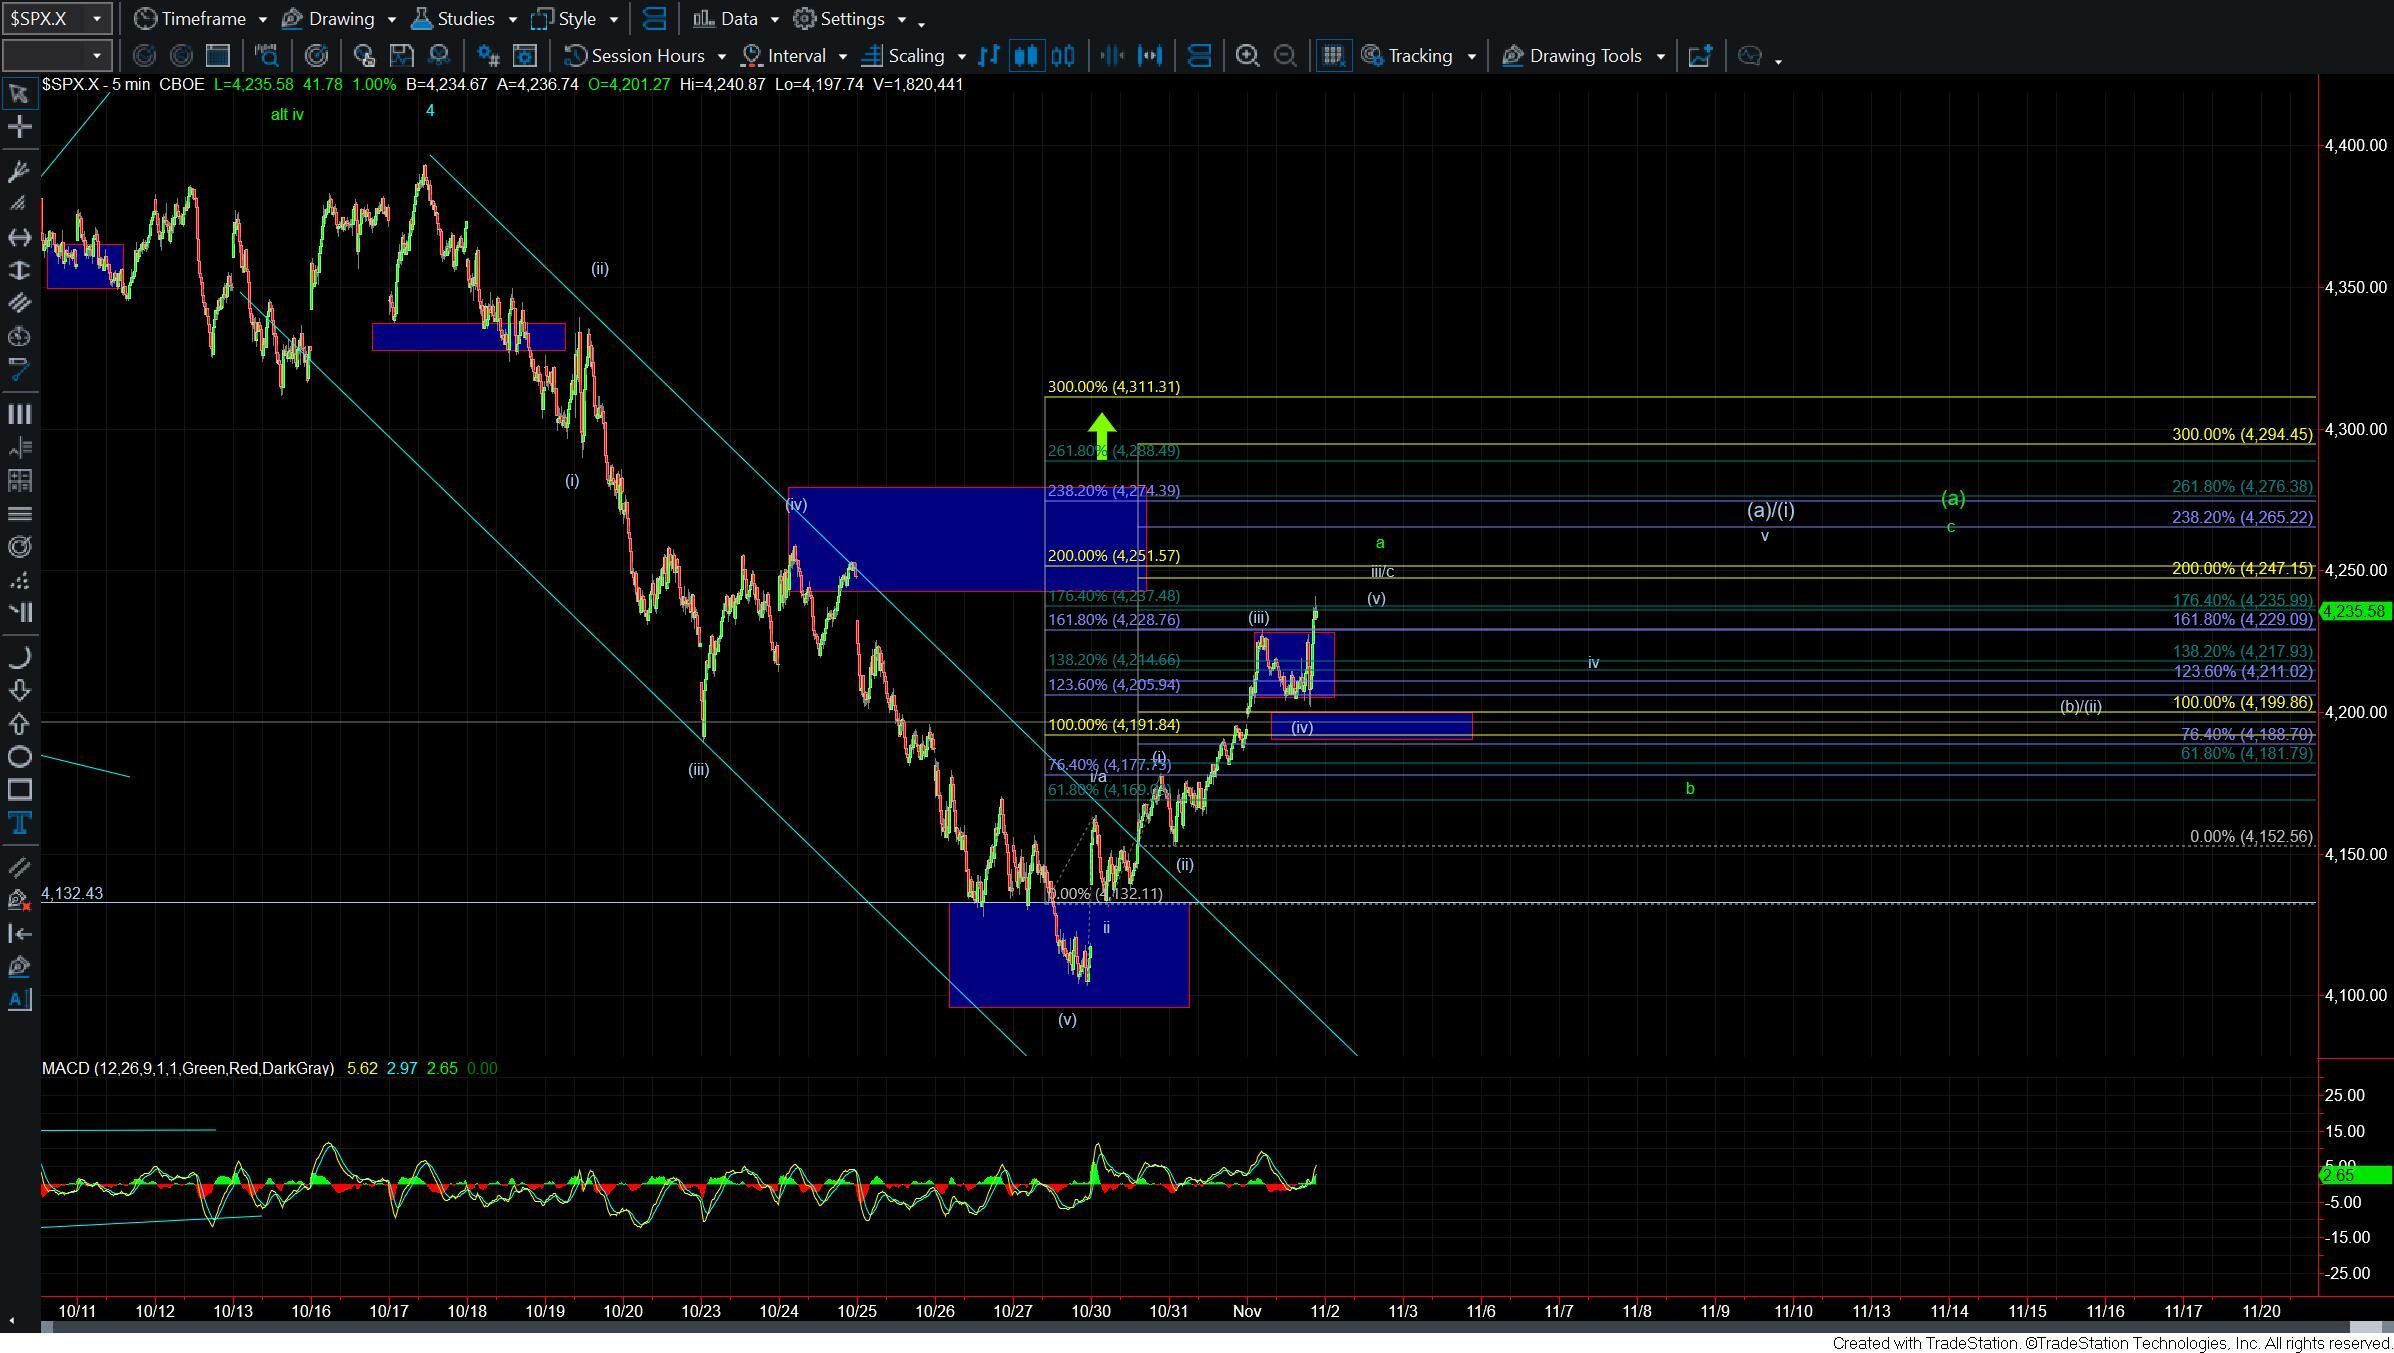
With the strong push up off of the lows, we still do not look like we have completed the initial wave a of (a) up off of the lows as shown on the five-minute chart. It is still a bit unclear as to where exactly we will see the top of this wave a. From a smaller degree perspective however as long as we can hold over the 4199-4188 zone we still can continue to extend directly higher even in this initial move up off of the lows.
Once we see a local top in the wave a of larger wave (a) we will be looking for a corrective pullback that is three waves in nature to signal that we have begun the wave b of larger wave (a). As long as that next pullback lower remains corrective three waves in nature then we still should see higher levels in the weeks ahead.
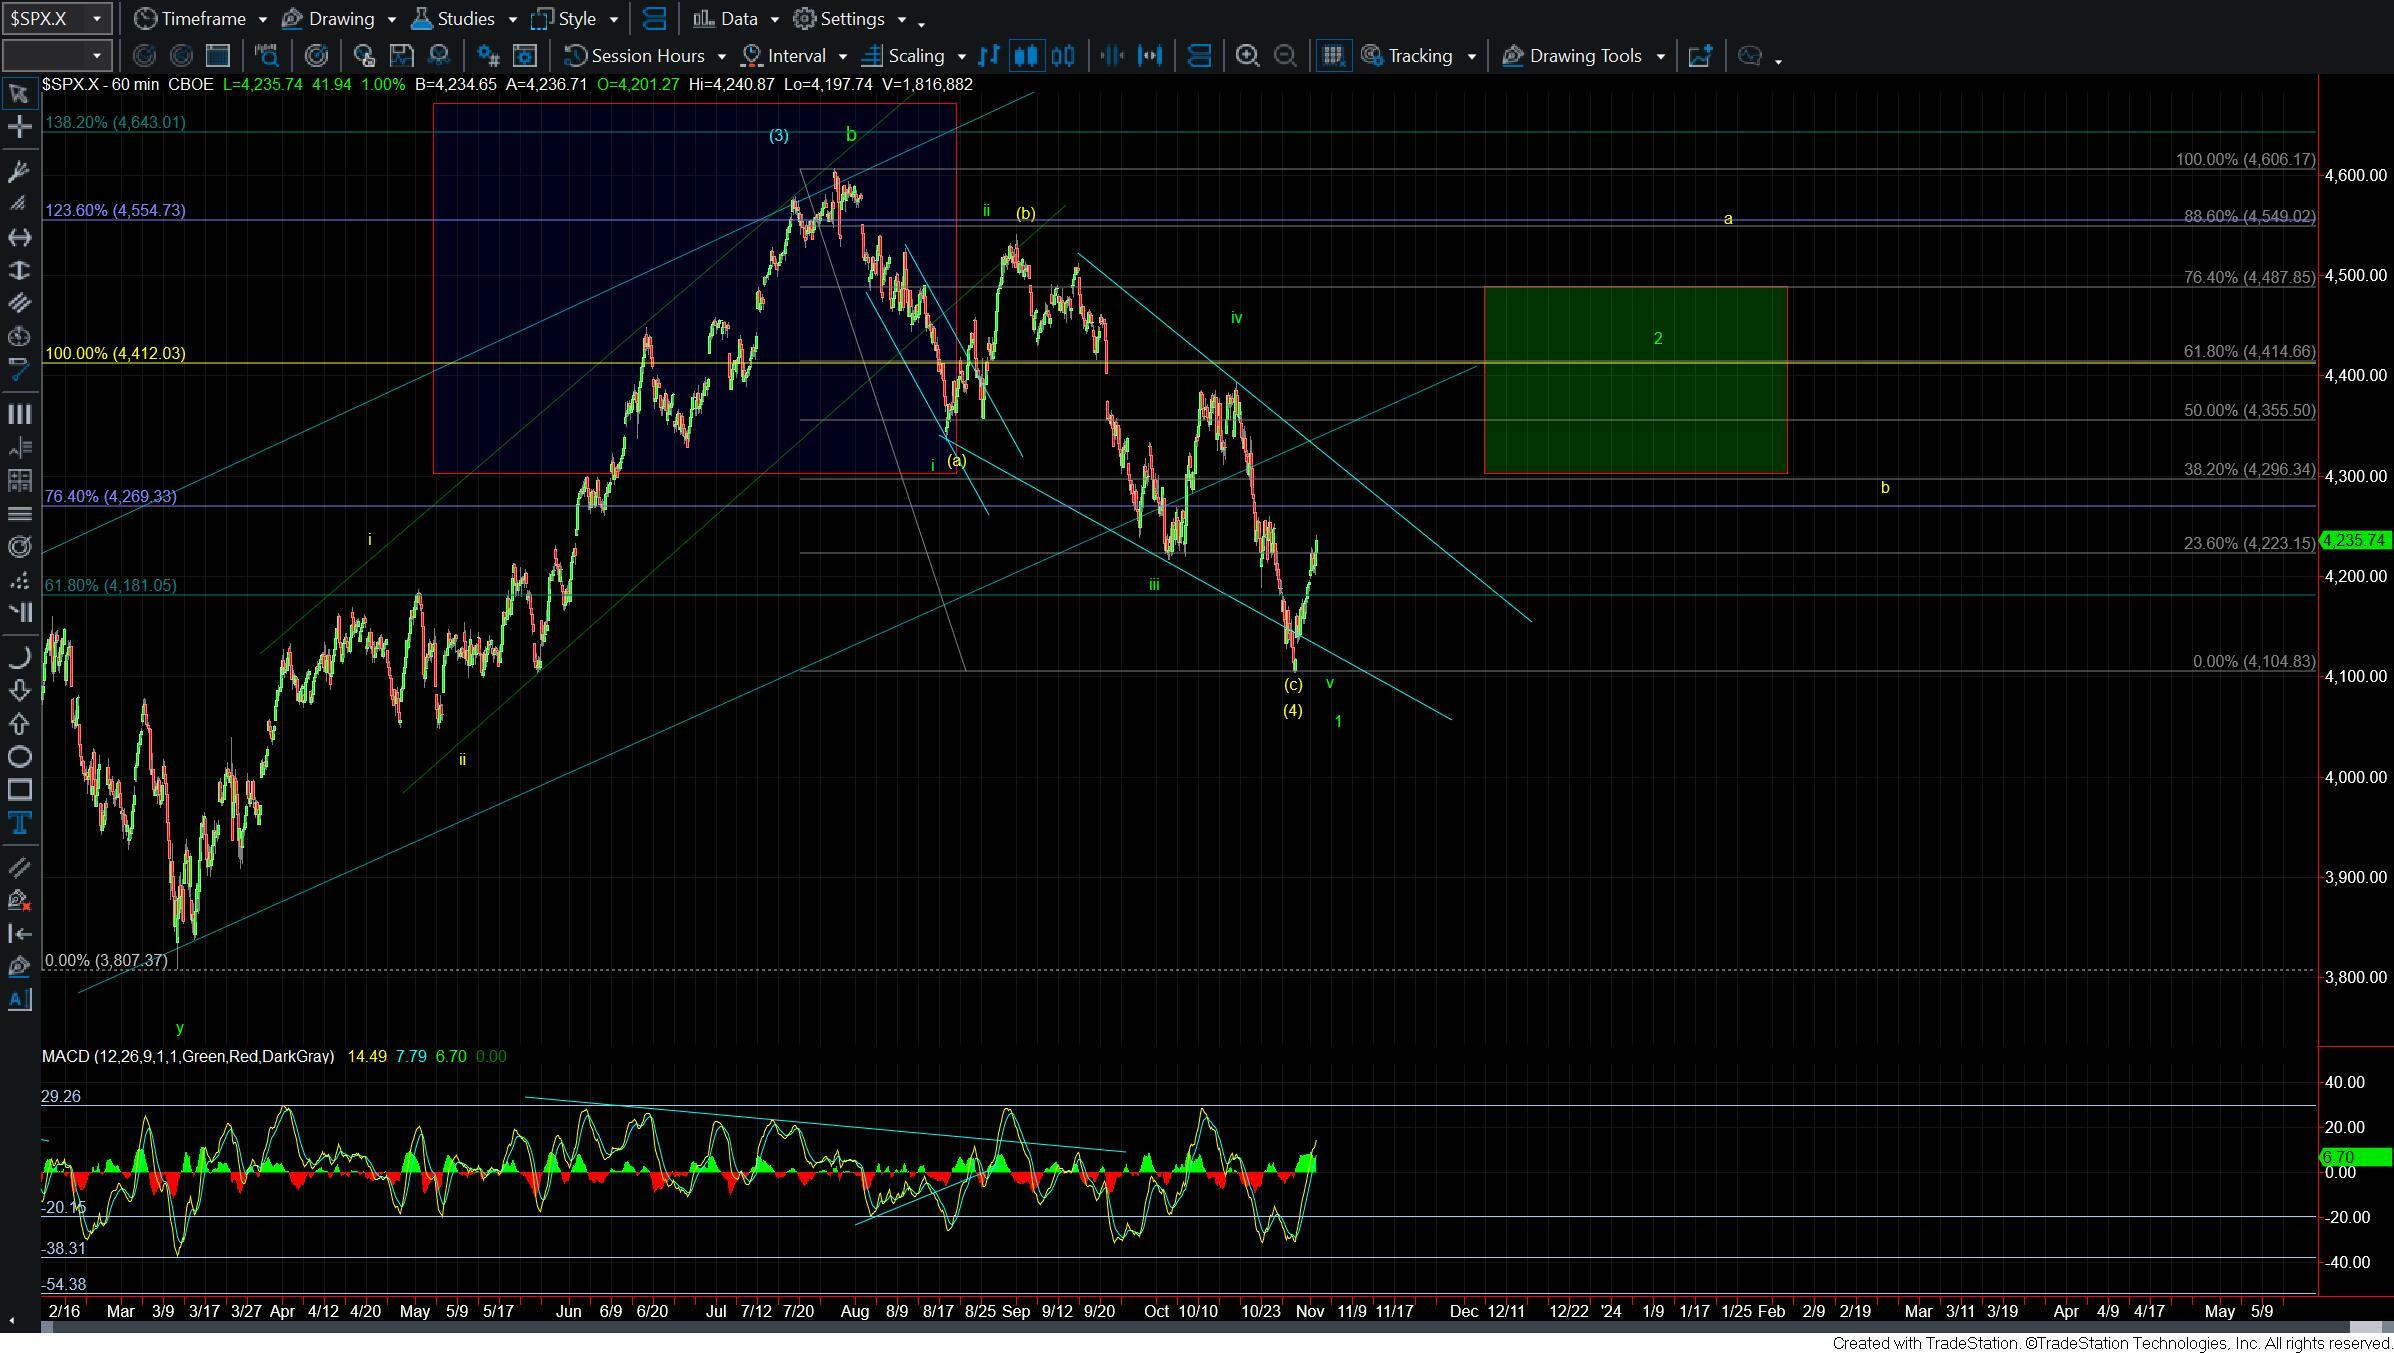
As we are now through the 23.6% retracement level at 4233 as shown on the 60min chart from a larger degree perspective we can look towards the 4296 which is the 38.2 retrace of the entire move down. It is quite common to see the market pullback at this level on corrective moves. So if we continue to see strength in the coming days this will be the next larger degree fib resistance level that will be on the radar to watch.
So while we still have a bit more work to do to fill out the count and give us a better idea as to whether we are following the green or yellow counts today’s continuation is giving us further confirmation that this rally should continue to carry us to at least the 4350SPX region over the coming weeks and months.