Market Sees Another Tight Range While Holding Over Support
Today we saw the market move slightly over the previous high only to be quickly rejected lower. That move lower however did not last long either and we spent the rest of the day consolidating near the highs but over support. So with the market trading in a very tight range and still over even upper support at the time of this writing the parameters that I have laid out over the past several days remain for the most part the same.
As I noted yesterday we are still very overbought on the smaller timeframes and a pullback for at least a fourth wave should certainly be in the cards in the not-too-distant future. With that being said however until we can break under upper support we still do not have any signal that even a local top is in place just yet.
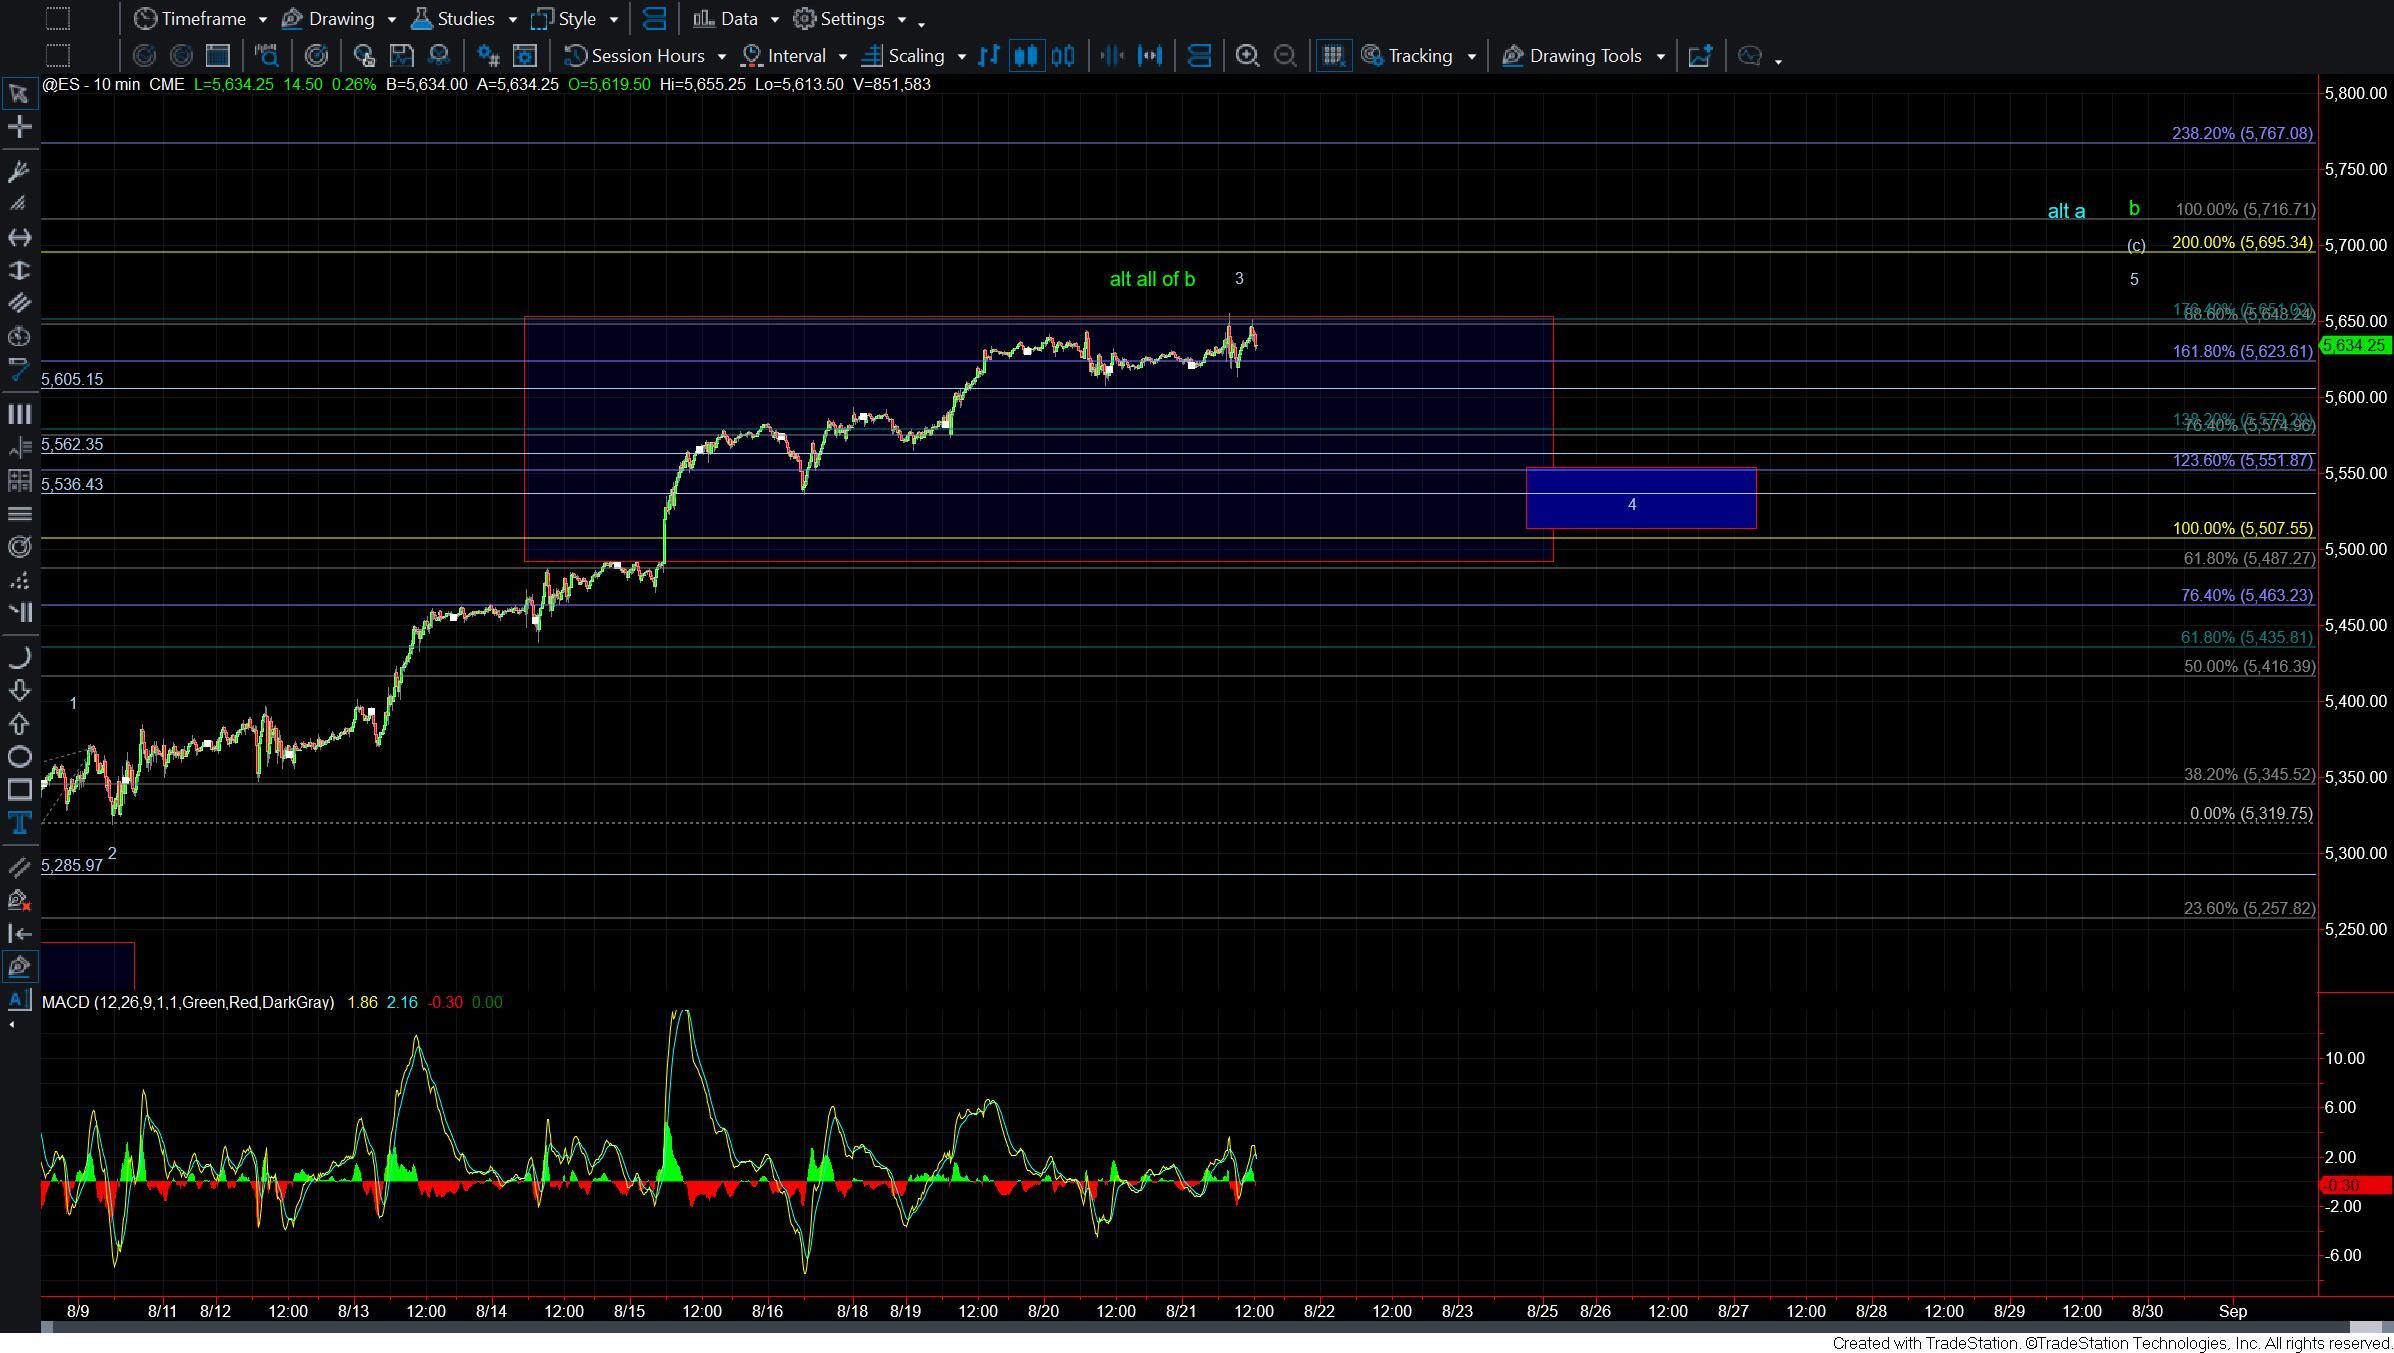
Drilling down to the smaller timeframe ES charts I still would want to see a break under the 5605 level followed by a break under the 5562 level to suggest that we have topped in at least the wave 3. From there I would be watching the 5551-5507 support zone. This is the ideal zone that should hold if we are indeed going to see this continue to grind higher. Any pullbacks should also come in the form of three waves into that support zone.
Should we begin to see a break of that zone and/or a full five down off of the high then it would give us an initial signal that we may have put in a large degree top. We would of course still need to see a further break of the 5435 level followed by a break of the 5319 level below to give us additional confirmation of a top. As long as we remain over those levels however we still likely need to see at least one more wave 4 and 5 to finish off this wave (c) up off of the lows.
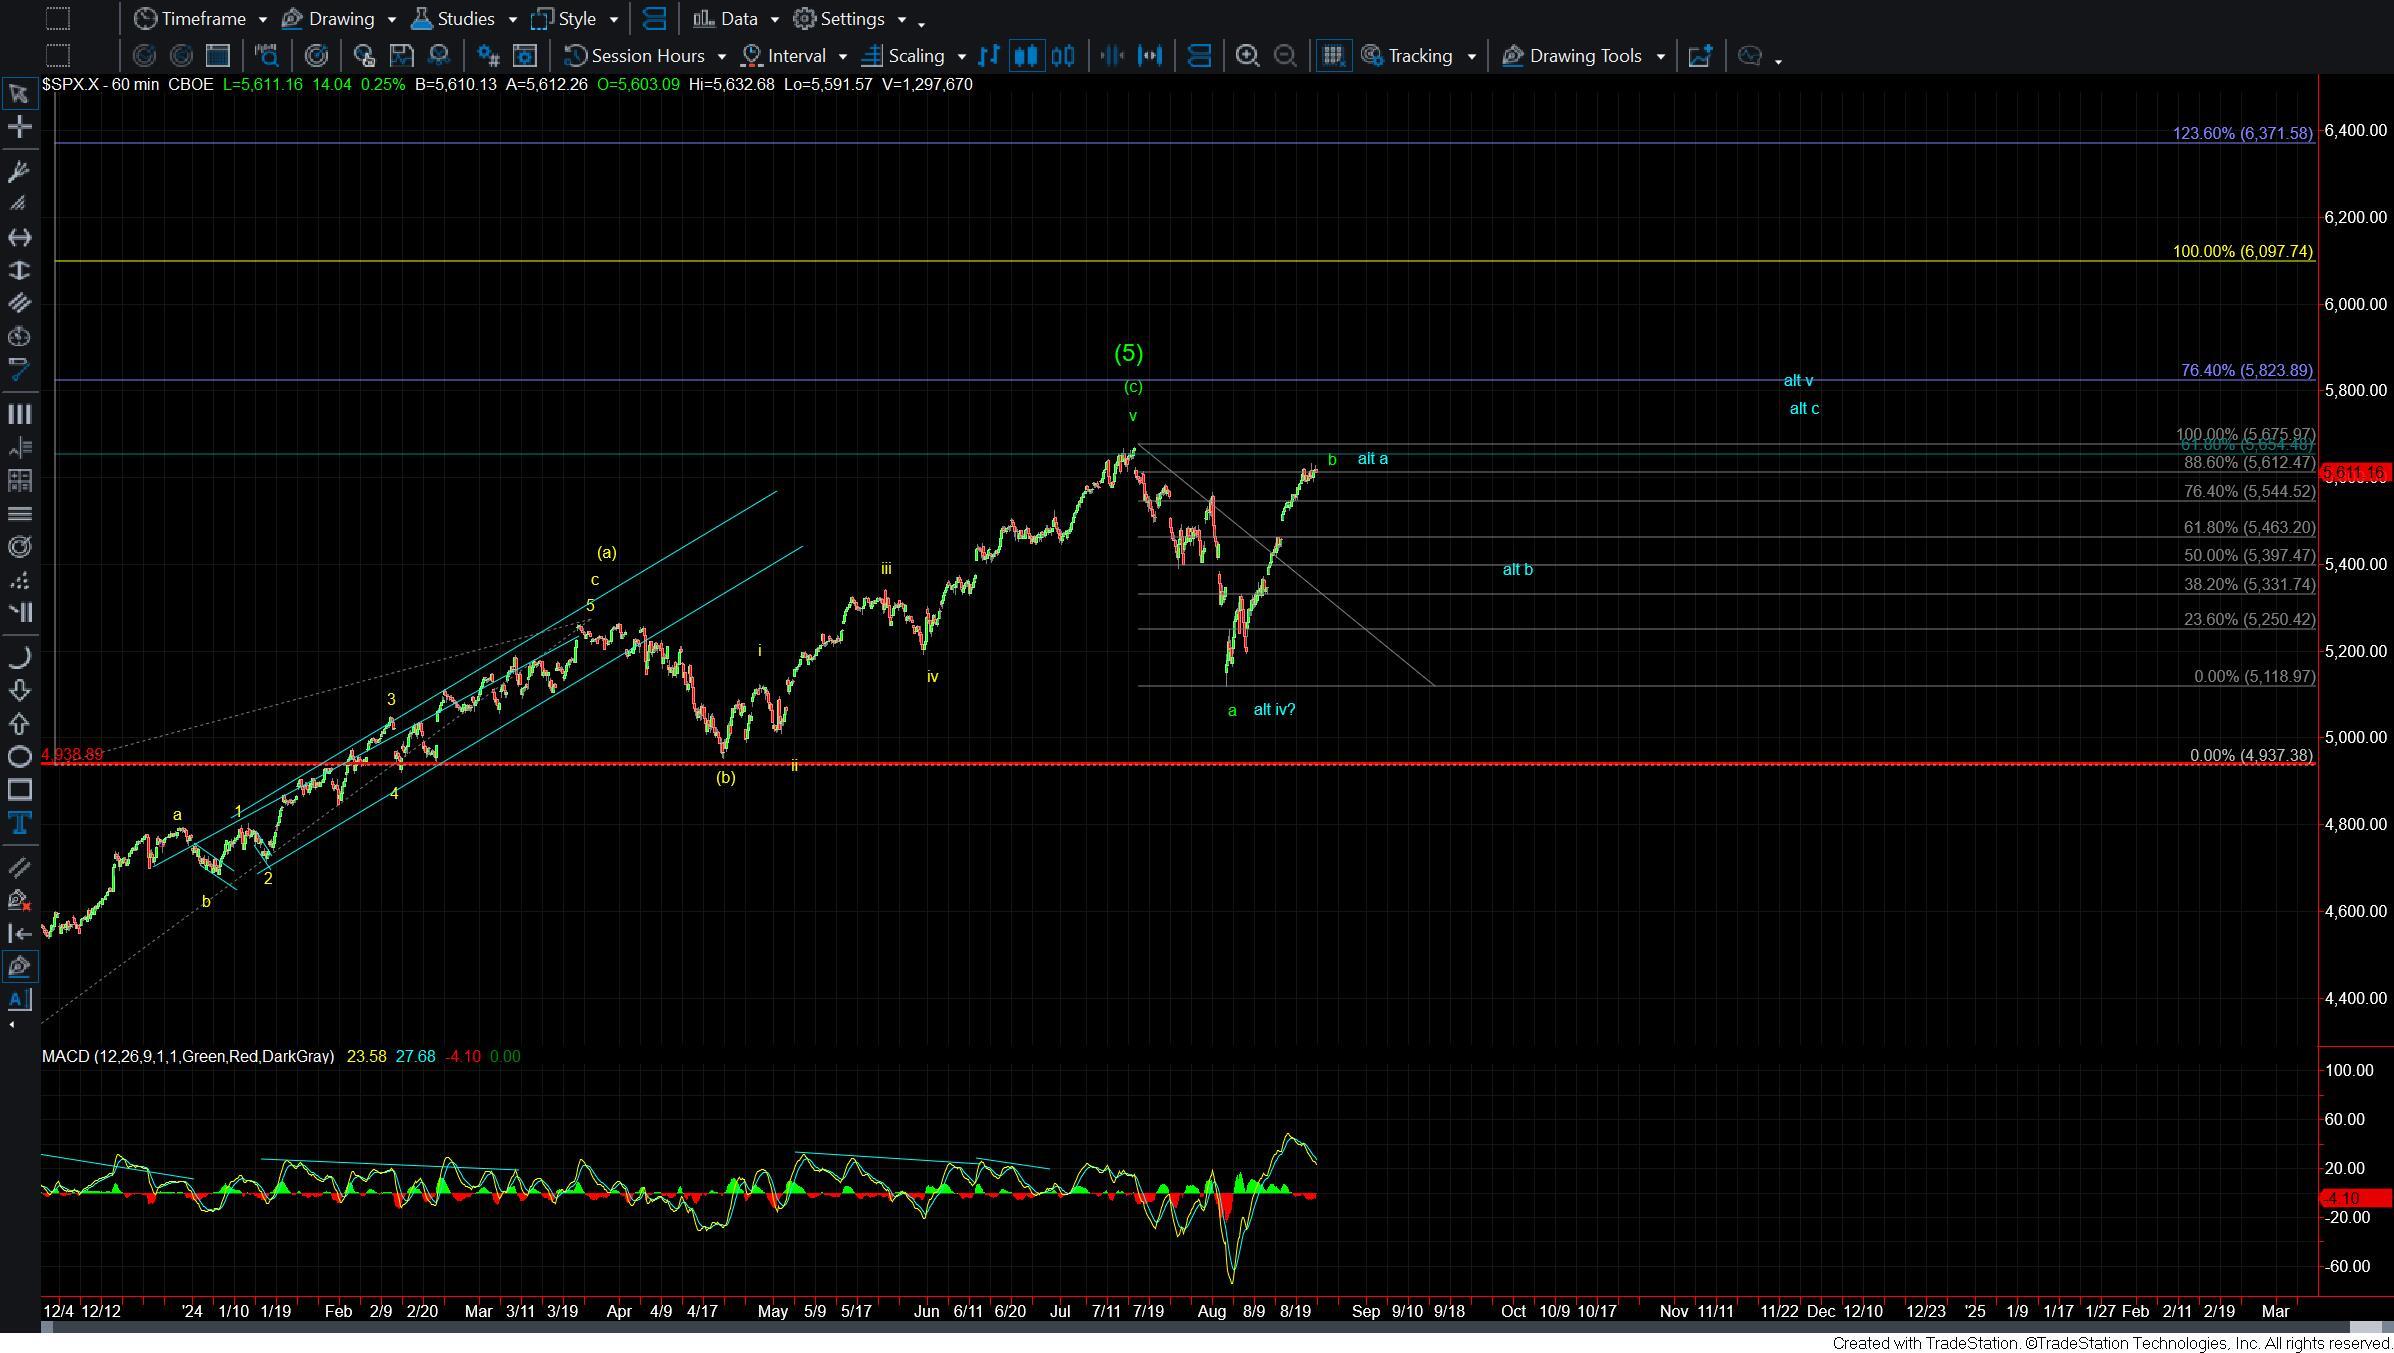
The bigger picture still has no change from the weekend update. We still will need to see the structure of the next move down after we top in the wave 5 of (c). That will help determine whether we are going to see a top in the larger green wave b or simply just the blue wave a that would then be followed up by a wave b down and another wave c up to finish off the larger degree pattern.


