Market Sees A Pullback But Still Sitting Over Support
 By
By
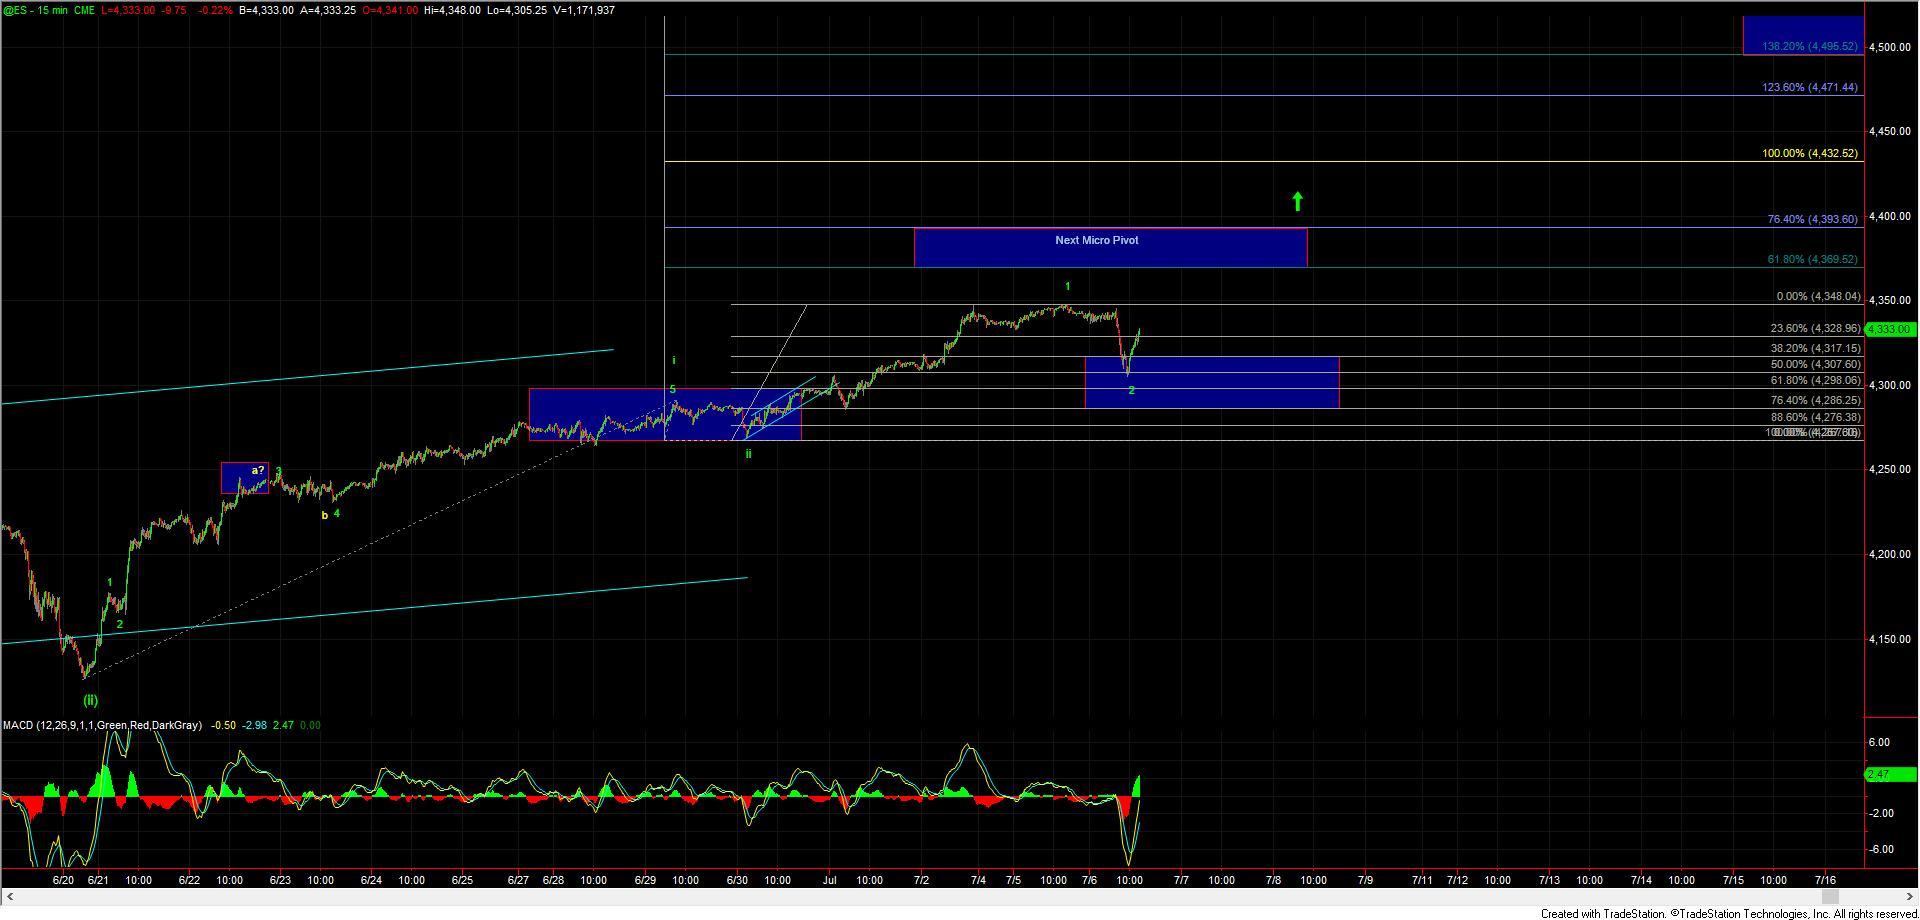
After consolidating over the holiday trading session and overnight we saw the ES and SPX take a bit of a pullback into the early afternoon session. This pullback broke under the most upper support levels thus making it likely that we are now seeing another series of nested 1-2s on the more micro-scale. This path is shown on the ES chart and so far the pullback is has hit the 50% retrace level from the wave ii bottom and we have now what can be considered five up off of that low. As long as we can hold over today's low of the day at the 4305 level on the ES it is reasonably probable that we have formed a local bottom for that wave 2 of iii. We do however still need to see a push back up over the 4348 high followed by a move through the next micro pivot at the 4369-4393 zone to give us further confirmation that a bottom has indeed been struck. If we are unable to hold the low of the day then we will once again watch the 4298-4286 zone on the ES chart as key micro support a move through that 4286 level on the ES would then open the door to a larger degree top being in place.
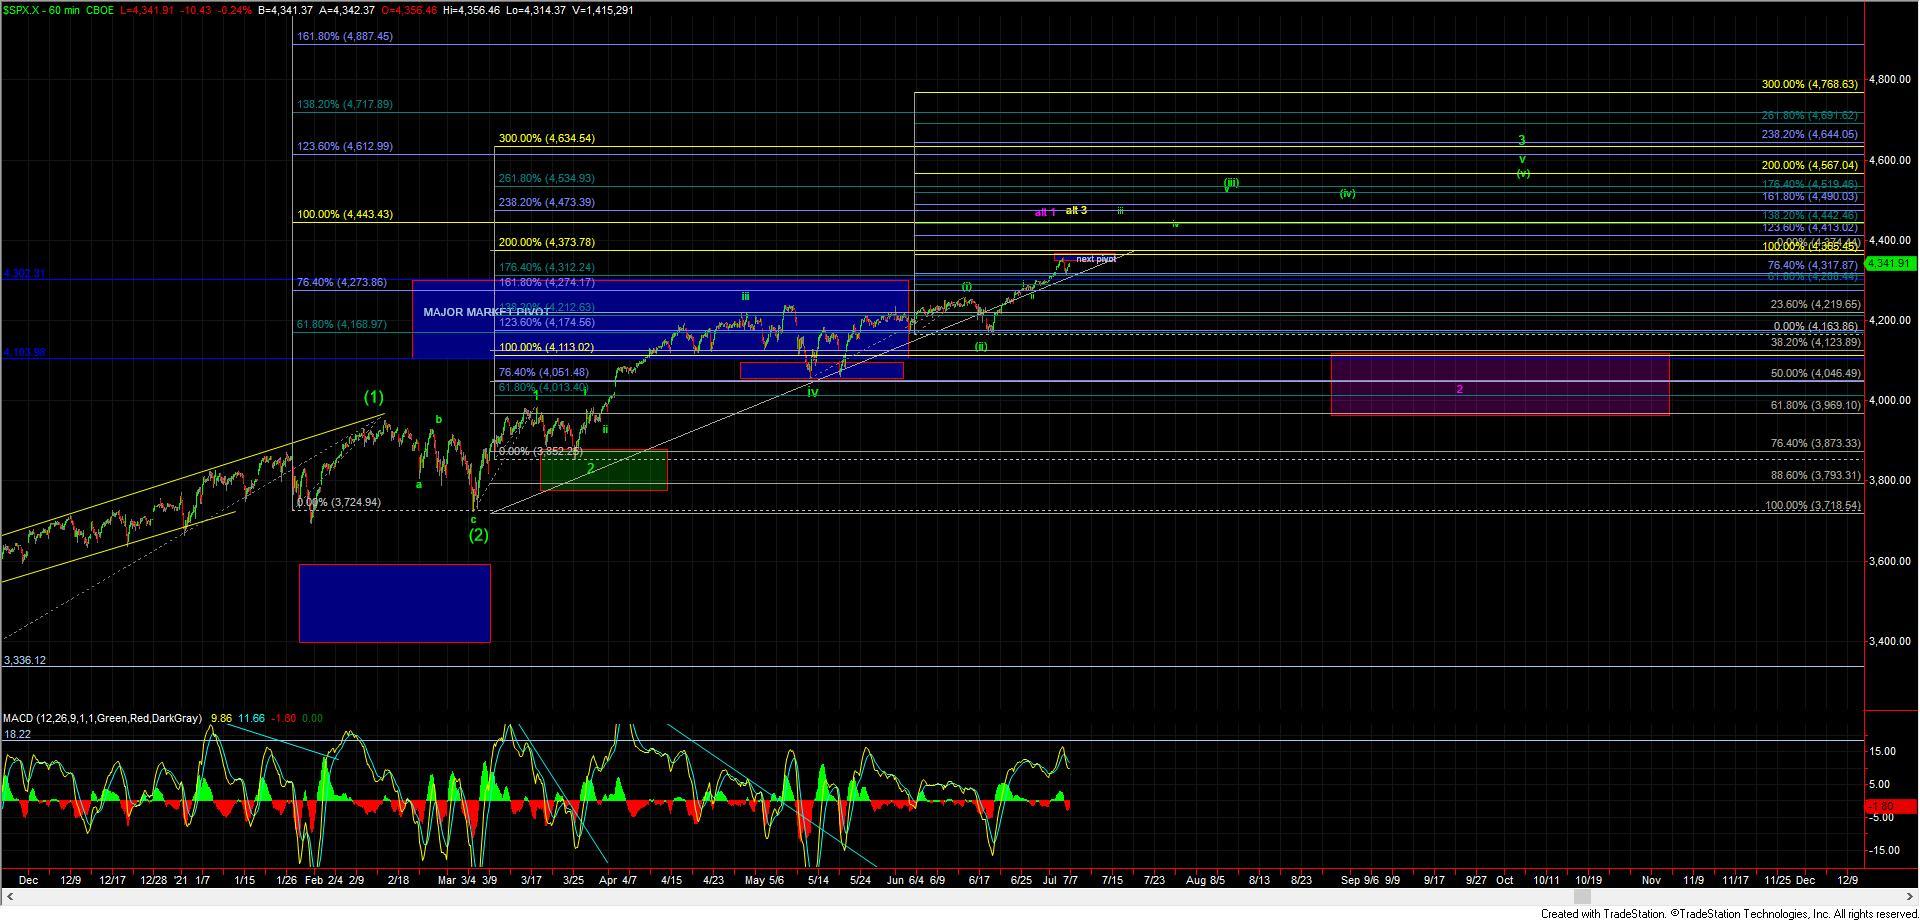
That top could take the shape of the wave 3 that Avi has laid out in his weekend update or still possibly the larger degree wave 1 which, while less than ideal, I still have not fully ruled out. I am showing this in purple on my charts (charged from yellow) to align with Avi's current alternate color labels. While the overall large degree pattern would be different under those two scenarios should they occur in the near term they would actually look very similar as they both would be larger degree corrective patterns that have similar support regions.
So with that, the key in the near term is simply going to see if we are able to hold over the upper support levels noted above. Should we hold those levels and continue to push higher than which of the alternate paths we may be dealing with are really not all that relevant. If we do break those upper support levels and begin to show signs of a larger pullback sooner rather than later then we will better be able to define those key support levels which at this time are likely going to come in near the 4100-3960 region under both of the alternate paths.