Market Remains in No Man's Land
 By
By
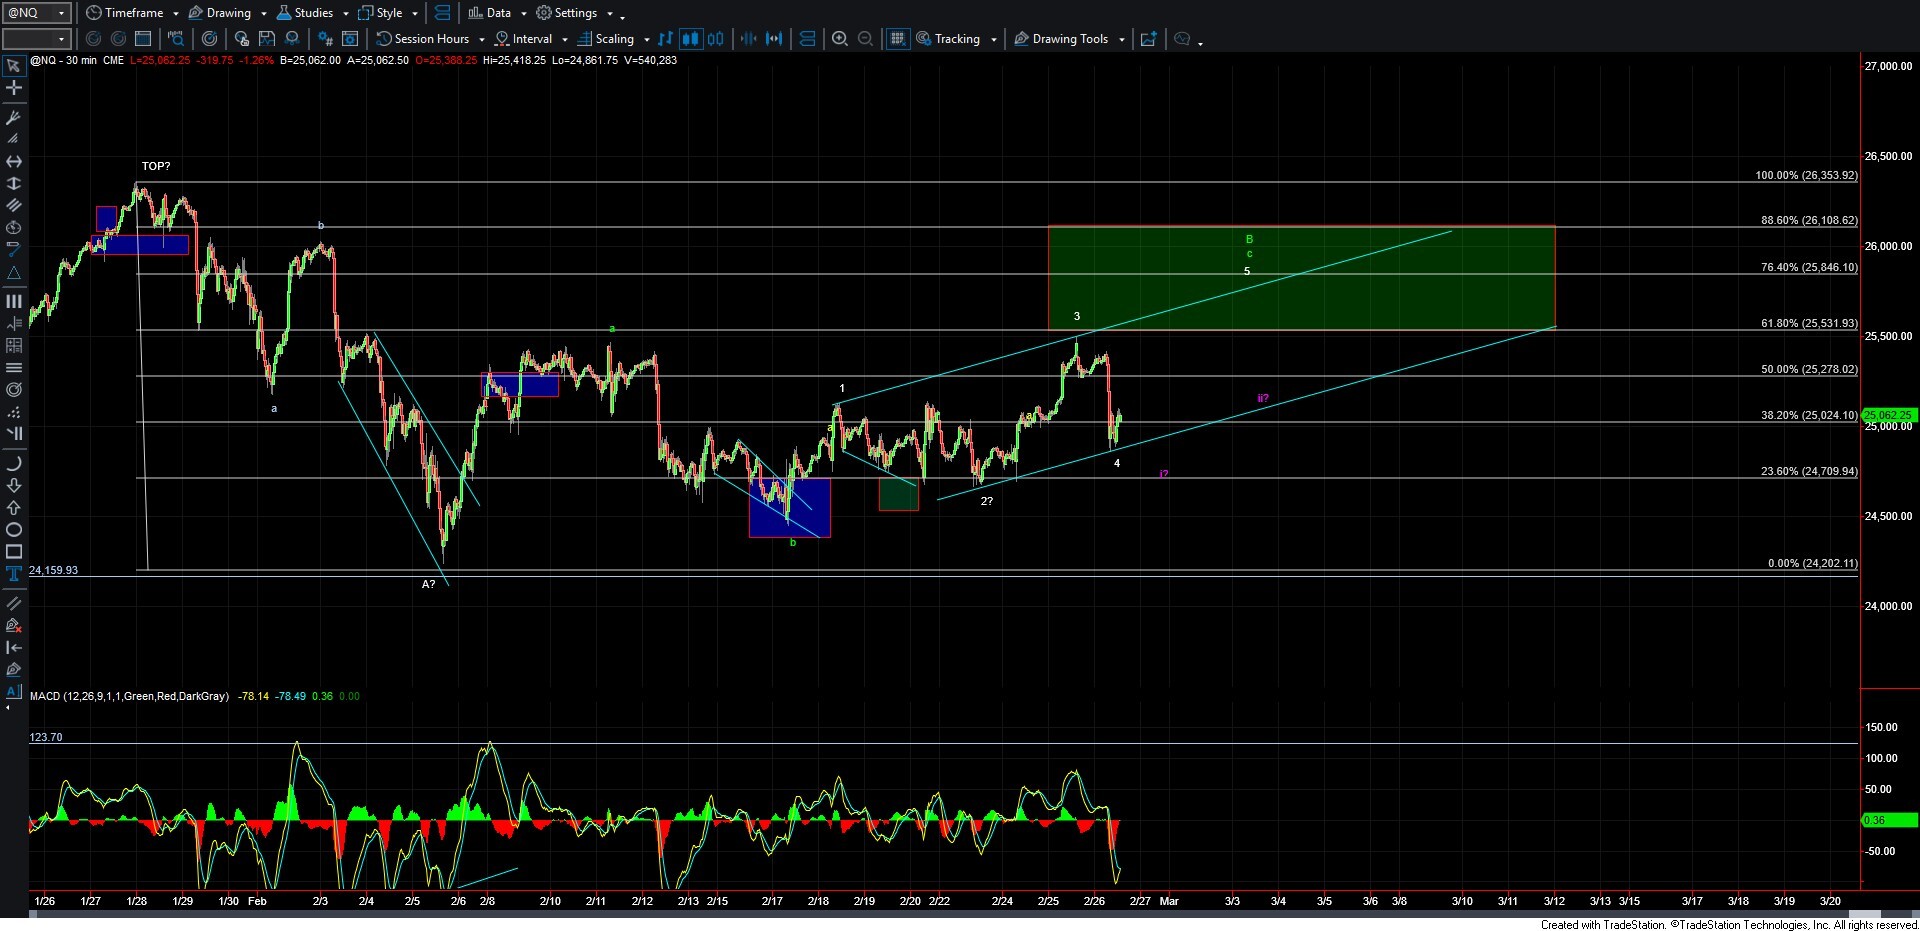
Today we saw the market turn sharply lower and then find support into the afternoon session. We are still trading well under the HOD but have yet to break micro support to the upside, which still leaves a number of possible paths on the table as we head into the close. I will note that I think the Nasdaq is painting a slightly cleaner picture at the moment, but we will need to see how things follow through in the days ahead before we really have a better idea as to the market's intentions as we move into March.
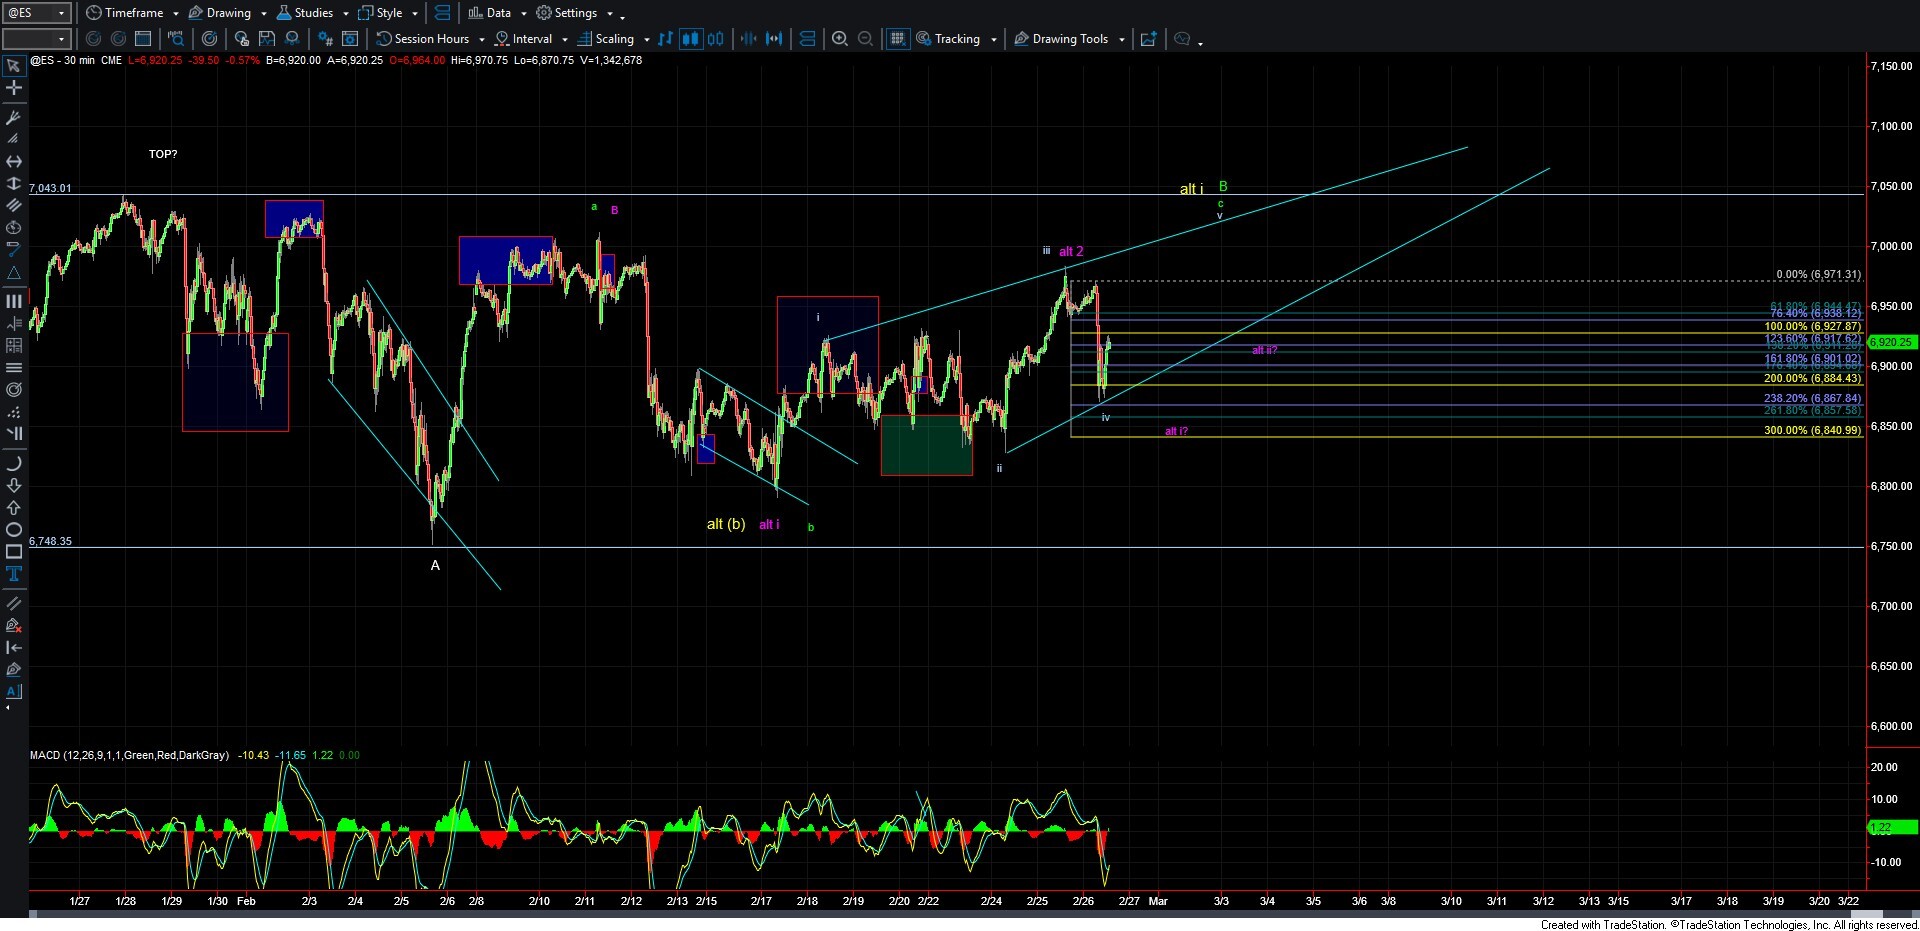
I have cleaned up the ES chart a bit and, unfortunately, have to show three potential counts for the time being. We should be able to eliminate at least one of them in the next couple of sessions, but we will need to see how price cooperates before I can say that with certainty, so for now I will have to track all three.
The previous white count is now shown in purple. Under this count, I would want to see this hold under the 6927 level, followed by another lower low to give us a possible five down off of the highs. This would then need a corrective retrace, followed by a break under that low and ultimately under the 6750 level to confirm that we are following this path. At this point in time, I am not placing a terribly high probability on this count, but if we do see five down followed by a corrective move higher, then it would increase the odds of this playing out. I will continue to track it as long as we hold under resistance and/or if we do see that possible five down.
The yellow count is a variant of the previous red count. With the deep retracement today, I don't think this move has enough juice to be all of the possible wave (c). So under this yellow count, I would be tracking the move off of the 2/17 low as a leading diagonal, which still needs a higher high to finish off wave i of that larger wave (c). As this is a possible leading diagonal with a very irregular bottom, I have a hard time placing a high level of confidence in this count, but as we are stuck with three less-than-ideal counts here, I will continue to track it as long as it remains valid by holding over the 6832 level. We would need to see this count make another higher high over the 6977 level, followed by a corrective retrace lower, to give us initial confirmation that this count is playing out.
Finally, the green count would suggest we are following a larger B wave off of the 2/5 low. Under that count, we would need another higher high to fill out an ending diagonal for a wave c of that B. If this count plays out, it would likely result in a very deep wave B that could even exceed the previous all-time high. That fact makes this yet another count that is difficult to rely on. With that said, I think this one fits better with what I am tracking on the Nasdaq if we do indeed see this push over today's high.
So for now, I will continue to watch the price action and see how this develops, but until we start to see a break of some of the price levels noted above, I will continue to track all three of these counts and make further adjustments as needed. From a trading perspective, I will be very patient here and wait for the market to provide a clean setup, and until it does, I am sitting on my hands.