Market Remains Resilient - Market Analysis for Oct 9th, 2026
 By
By
After moving lower yesterday, the market pushed back higher today, keeping the door open for further upside action and another push to new highs. Furthermore, today's move has invalidated the potential for a five-wave decline off the highs, making the possibility of a top in an expanded b wave less likely.
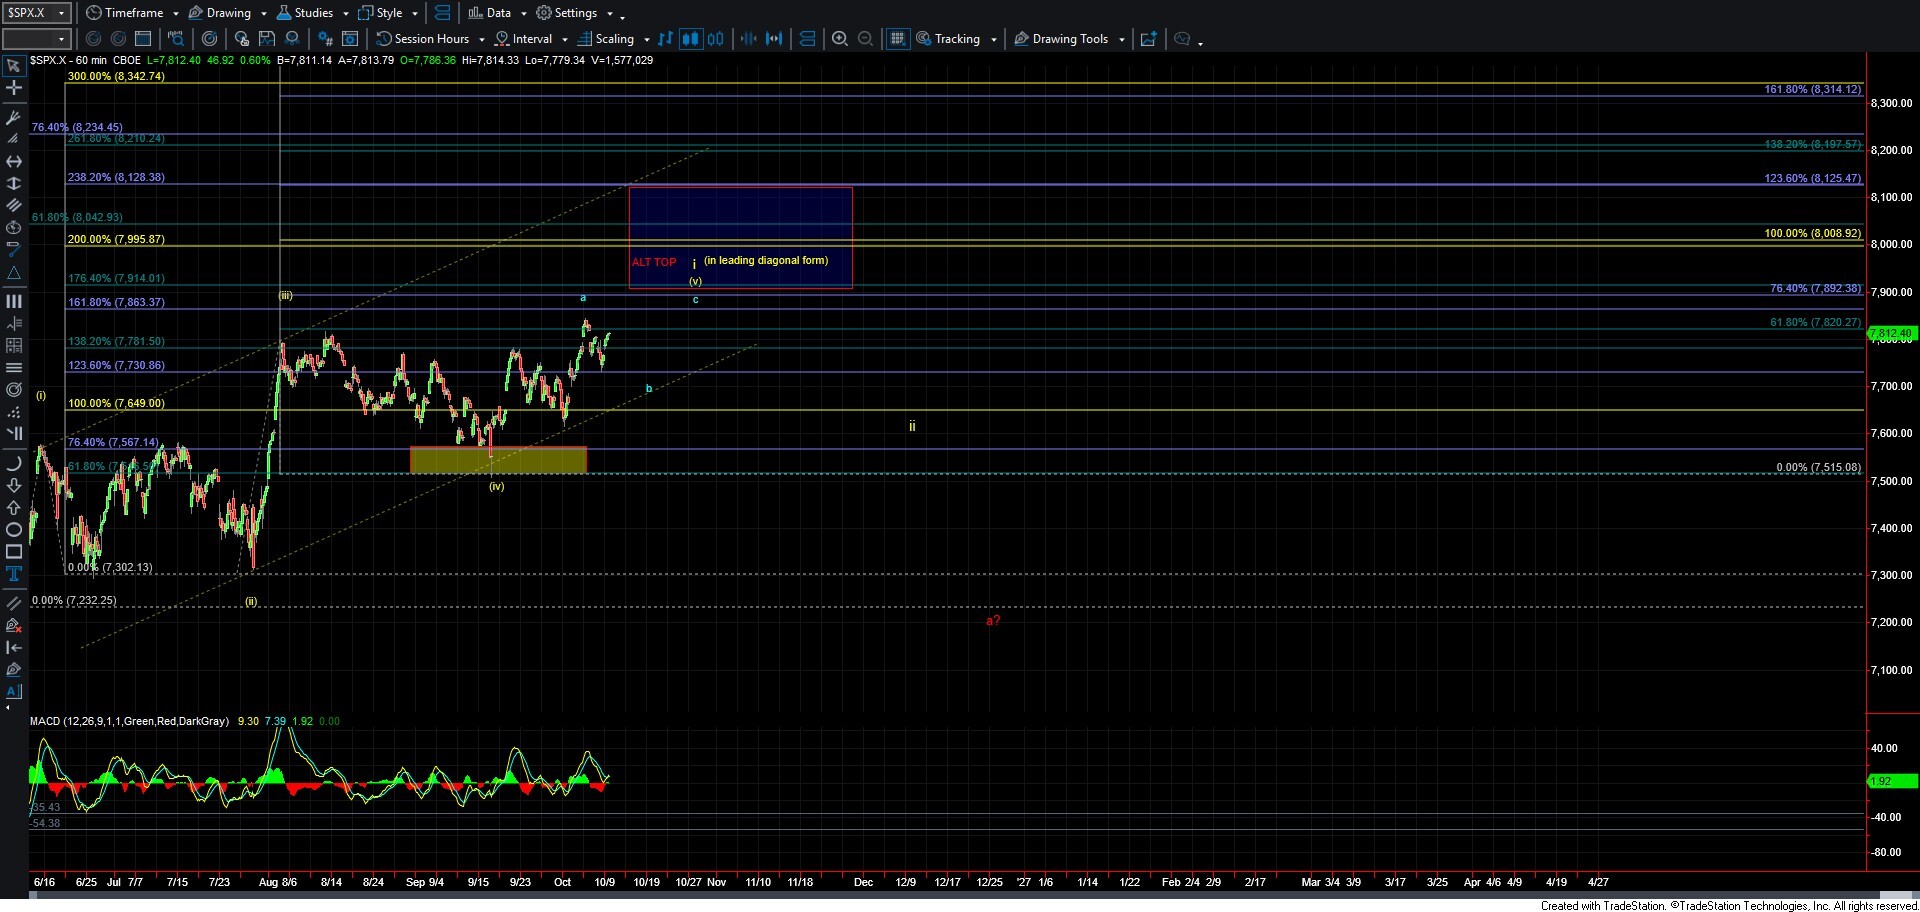
Unfortunately, the overall pattern on the smaller timeframes remains quite messy. As Avi noted yesterday, the SPX does technically have enough waves in place to consider at least a local top, so we still need to remain cognizant of that possibility. That said, I am personally still leaning toward the market pushing at least a bit higher before any significant top is formed. The bigger question is exactly how that move higher will develop.
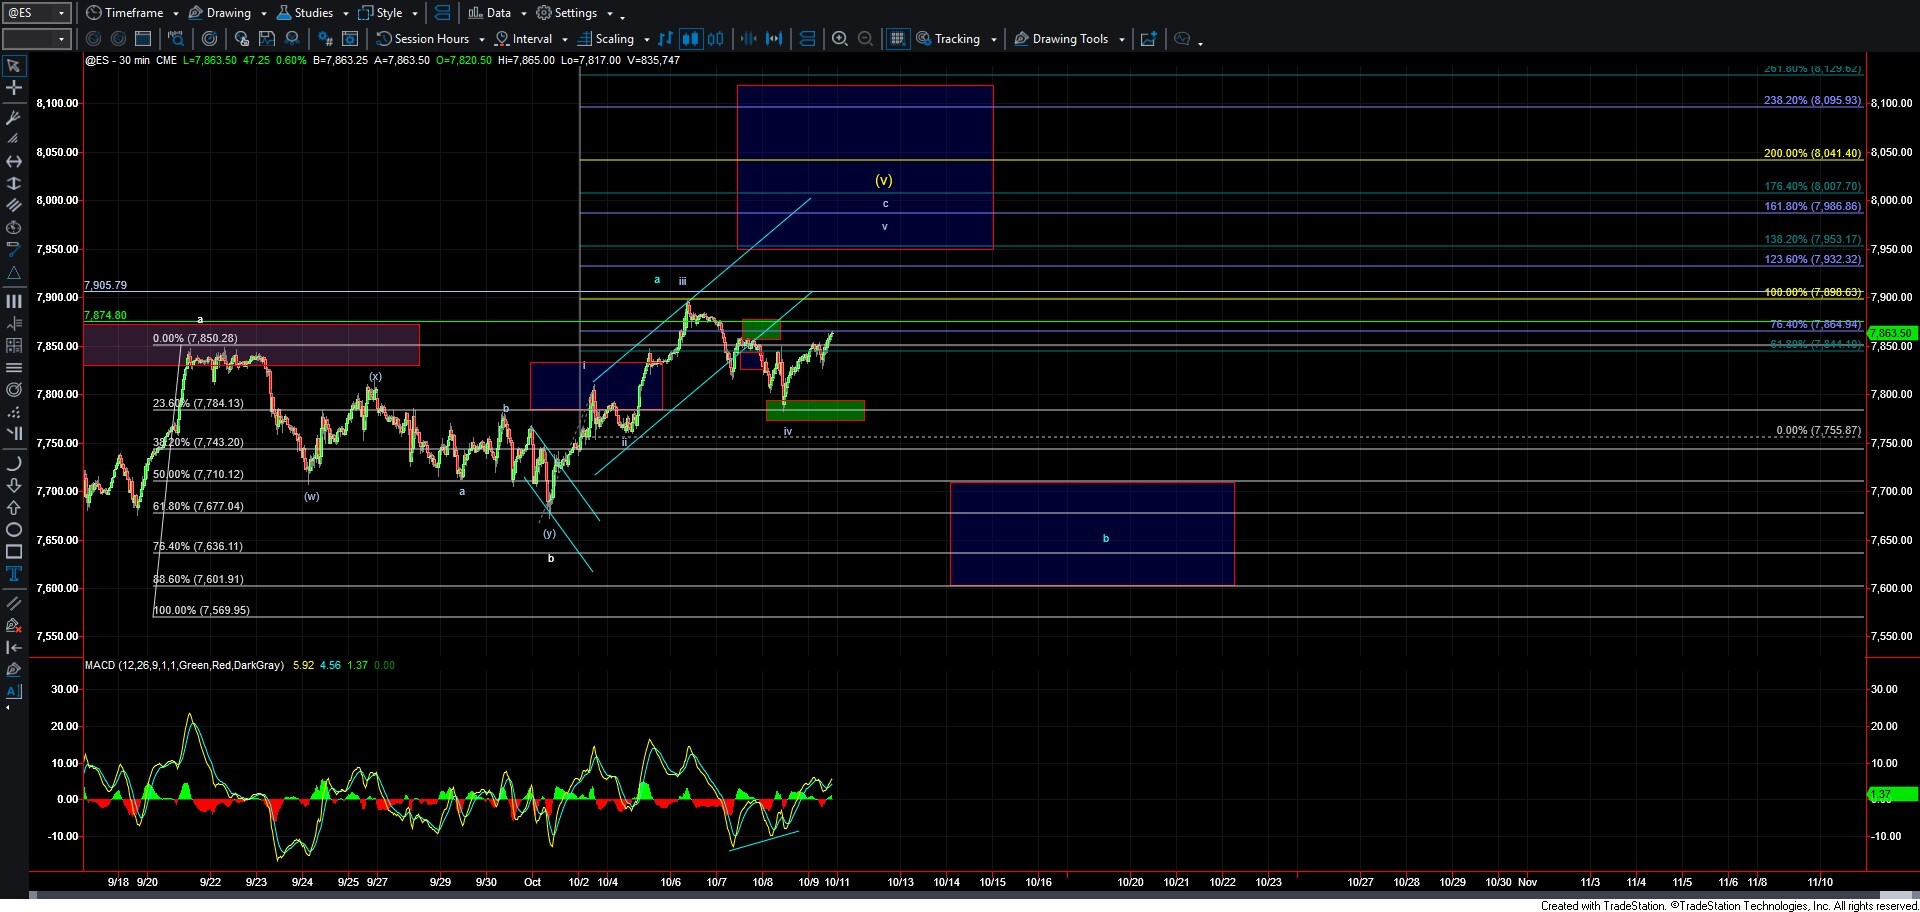
While I certainly remain cautious about the potential for a top being in place on the SPX, the fact that the ES has not made a higher high above the potential wave (iii) top continues to keep that scenario as my alternate count. It is quite rare for a diagonal to form a truncated top. While it can happen, especially when dealing with overnight futures action, it is still an uncommon occurrence.
Assuming we have not yet topped and still need another push higher, the question becomes which path the market will take. Unfortunately, neither of the two potential paths higher is without its issues, making it difficult to favor one decisively over the other.
I am currently tracking two potential paths to complete the larger diagonal. The first is the more direct upside path shown in white on the charts. This count suggests the market will push higher to complete wave c of (v) upon a break above the 10/6 high. For this scenario to remain intact, yesterday's low needs to hold, followed by a continued push toward the 7863–7995 resistance zone on the ES.
The second path, shown in blue, follows a larger a-b-c structure for wave (v) and allows for a deeper retracement in wave b before turning higher in the final wave c of (v) to complete the larger diagonal. Under this scenario, I would want to see the market hold the 7646 region on any further retracement.
Should we break below the 7646 level, followed by a break under 7500, it would open the door to the larger diagonal having already completed, whether following the yellow or red count. However, as long as we continue to hold that broader support region, I still think the cleaner interpretation favors at least one more push higher before a more significant top is formed.
I do want to emphasize that caution remains warranted here. We are potentially dealing with a larger diagonal that already has enough waves in place to be complete, at least on the SPX. Furthermore, the overlapping three-wave action within these diagonals can be quite unreliable and often provides very little follow-through.
So, while I still lean toward additional upside, this is not an environment where I want to force trades or get overly aggressive. For now, I will continue to monitor the key support and resistance levels and let the market provide us with further confirmation before committing capital to a higher-probability setup.