Market Refuses To Show Its Hand As It Lingers In No-Mans-Land
 By
By
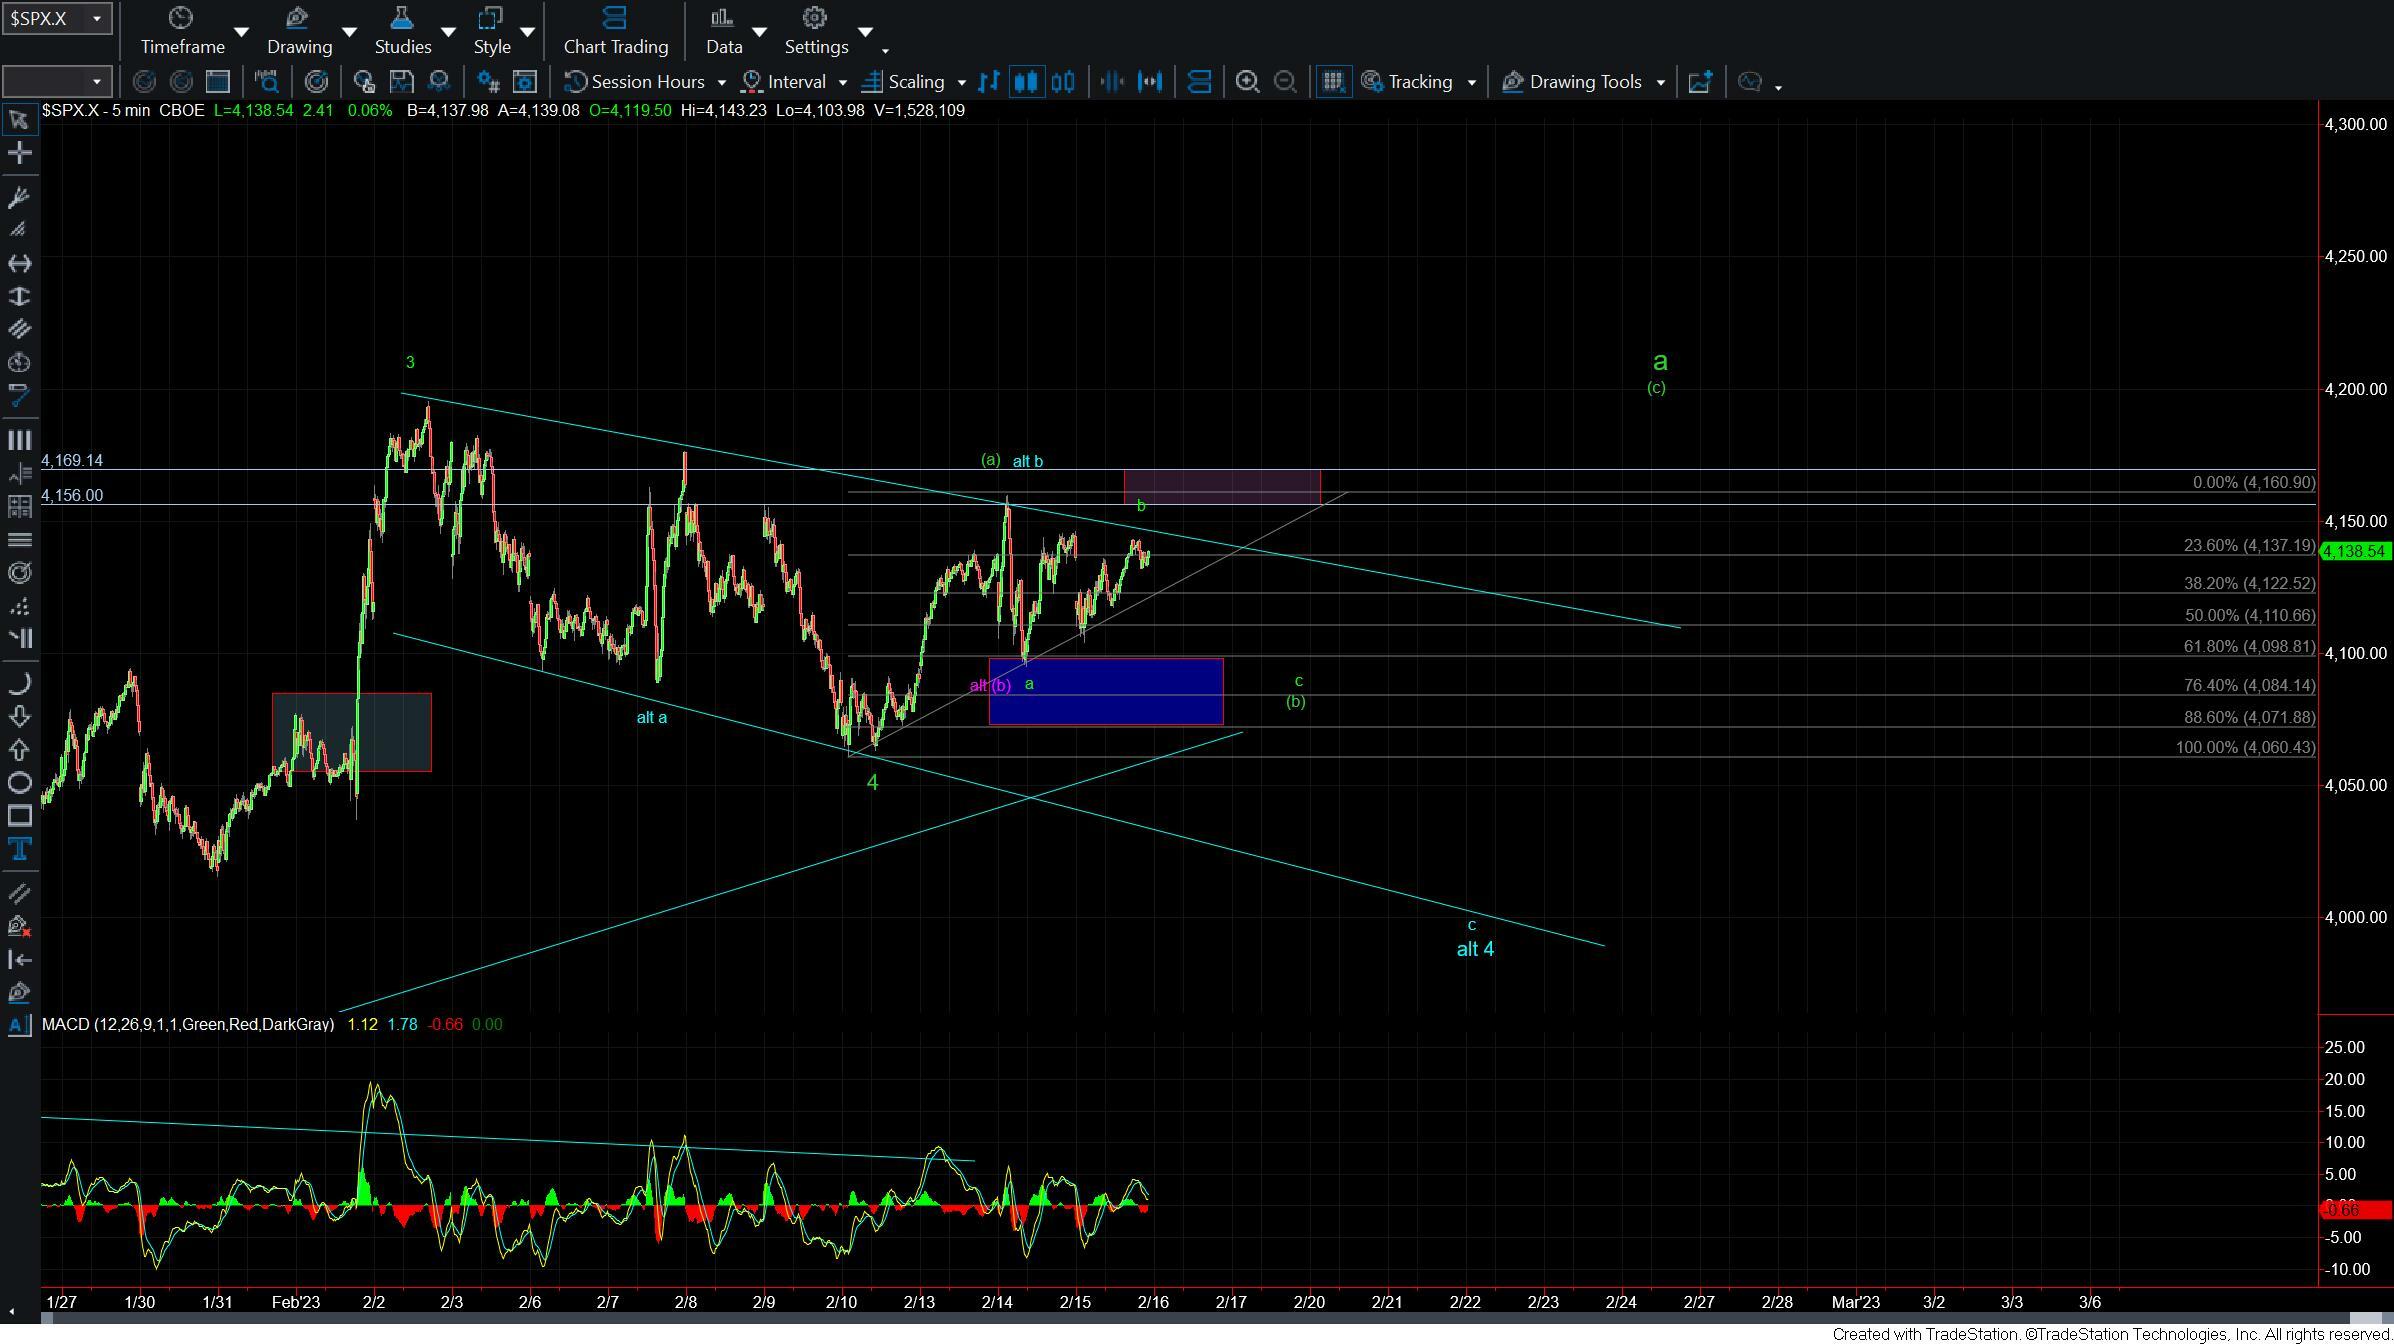
Today, the market opened lower but found support and pushed higher in the afternoon session. However, this move higher is corrective in nature and is currently being contained by the upper end of the upper trend channel near the 4140 level. This corrective price action and containment at that trend channel makes it less likely that the market has already bottomed in the wave (b) and is thus ready to see a direct breakout over the 4156 high without further consolidation.
The form that this consolidation takes is still uncertain, but there is certainly room for the market to move lower in a deeper wave c of (b) before turning higher again, given that it only hit the 61.8 retrace from the move up off of the 4060 low.
It is also possible that a somewhat rare b wave triangle is forming, but more work needs to be done to complete this potential triangle before this path can be adopted as the primary count. For now, the focus should remain on the key support levels below and pivot levels above to better understand which path the market will follow. Patience is required as the market attempts to resolve itself out of this sloppy price action on the smaller timeframes.
Because the price action up off of yesterday's lows is counting best as corrective in nature, my base case suggests that the market will see another wave c of (b) down. This is shown on the 5 min SPX chart in green, and under this case, it would be necessary to hold over the 4098-4071 zone below upon any move lower for that wave c of (b). If the market can hold that zone, then a full five-wave move up off of that lower low to start the wave (c) of a up would give us an early signal that a bottom of the wave (b) is in place.
If the market is unable to hold over that 4071 level, then it would open the door for the market to move lower in the blue wave c of deeper wave 4 back under the 4060 low, thus dragging out this wave 4 consolidation further into next week. However, I am viewing this as an alternate path at this point in time, and it will continue to be so long as the market can hold over 4071 upon any retrace lower.
Finally, if the market manages to break out directly to the upside without seeing a move under the 4100 low, then it is possible that the entire wave (b) is taking the form of a triangle. At that point, a break over the 4156-4169 zone would confirm a bottom and that the wave (c) of a is indeed underway.
In summary, one could simply focus on the overhead pivot at the 4156-4169 zone and downside support at the 4098-4071 zone. Holding over that support zone would mean the market is still in the green wave (b) count, and breaking over the 4156-4169 pivot would confirm that the wave (b) has been completed. A move under 4071 would be the initial signal that the market is following the alternate blue count to new lows. Until a breakout occurs over the pivot or under support, the market remains in a bit of no-man's-land, and for the time being, it is necessary to be patient as the market waits to resolve itself.