Market Refuses To Break Down
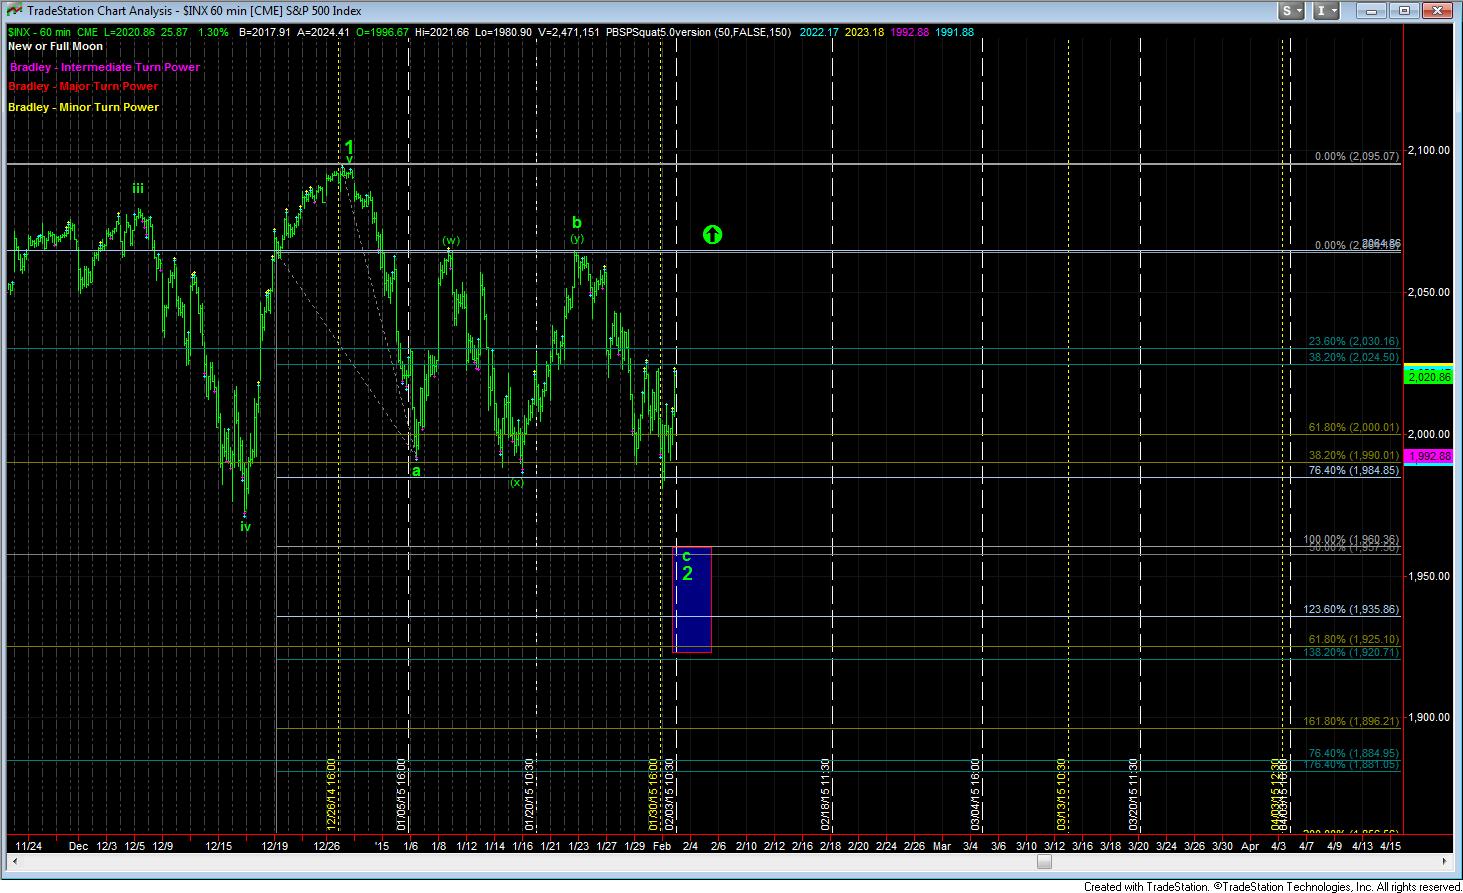
Even though the market spiked to lower lows as we discussed over the weekend, it still did not strike the top of the target box for wave 2. While there is potential to consider all of wave 2 in place already, when I look at all perspectives, including the IWM chart, it is very hard to not continue to look for that often elusive one more low.
At this point in time, we have now moved into the heart of the turn window we have been mentioning for weeks – January 30-Febaruary 3. That was the ideal time frame I was looking towards for a low to be made in wave 2. So, again, it is quite possible that the low has been struck, or it can be struck within the next 48 hours.
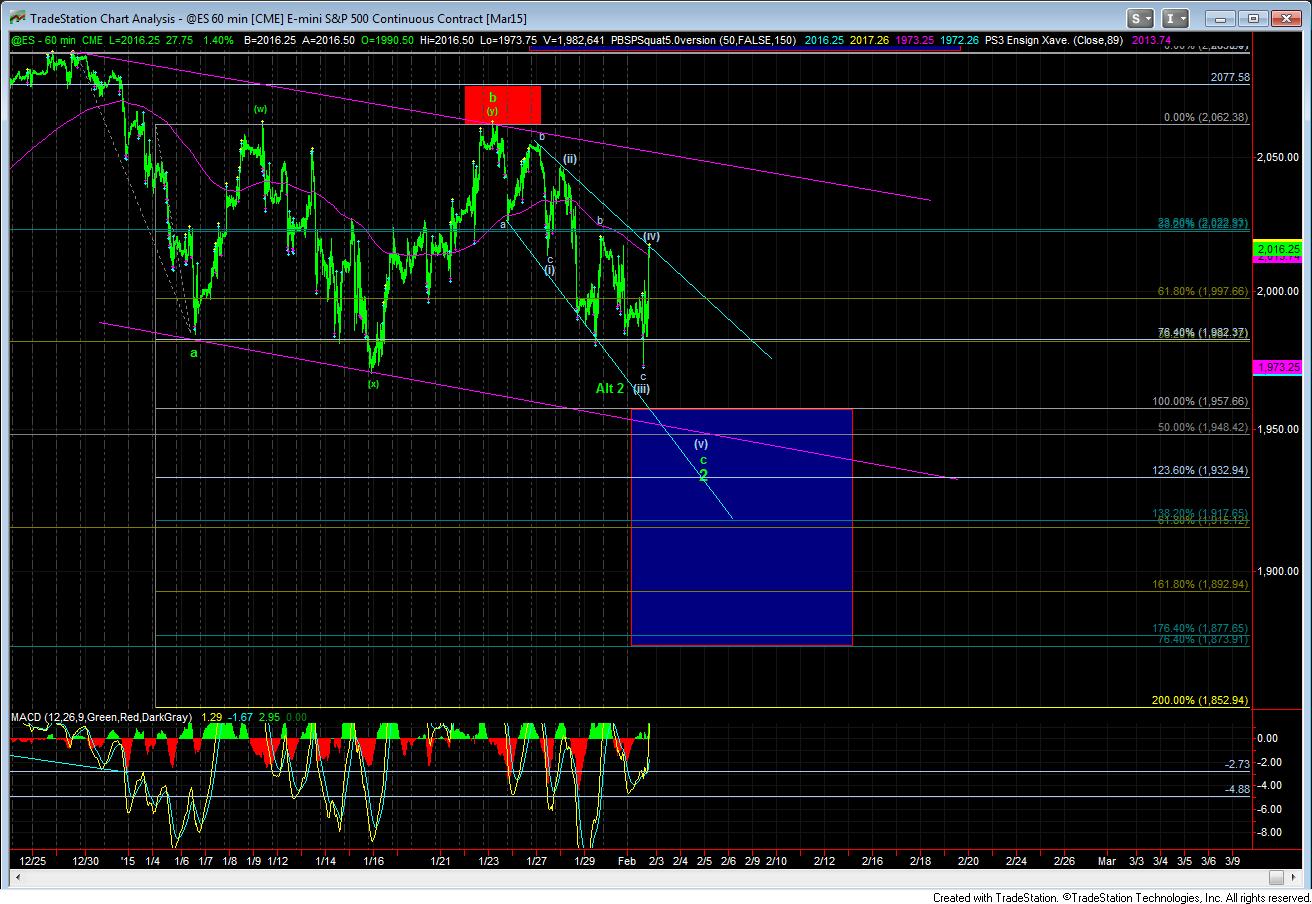
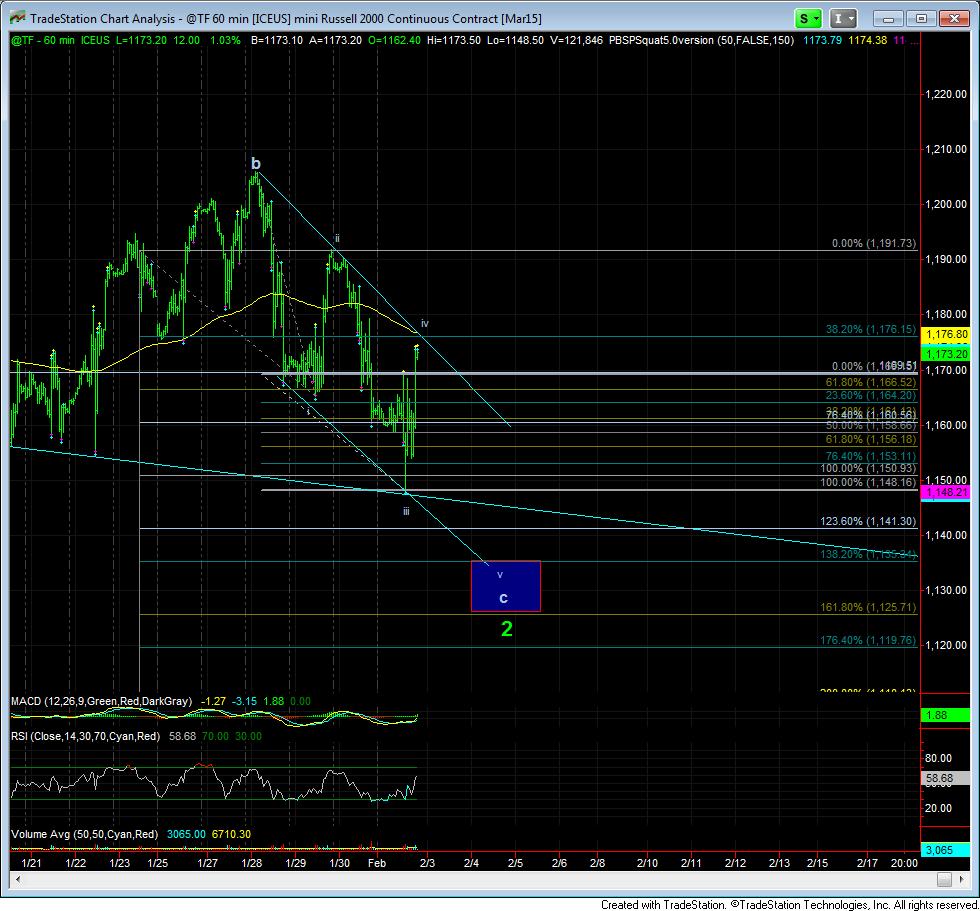
If you look at the ES and TF 60 minute charts, both can be counted as a 4th wave rise within this c-wave, specifically within an ending diagonal pattern. The ending diagonal pattern is what has caused the confusion we have seen for the last several weeks as we have meandered down towards our target. And, now, we have struck a low that is within spitting distance of our ideal target region.
As long as the market maintains below 2022ES, and the TF maintains within its down trend channel, I can still expect lower lows to be struck. However, if we see a continued move in ES to at least the 2045ES region, which would be the 2.00 extension off today’s low, then I would potentially count that as our first impulsive wave off the lows, and consider that we have potentially begun the run to 2200+.
A break down this evening below 2001ES is the first sign that we are on our way to 1957ES.