Market Rallies Into Resistance
 By
By
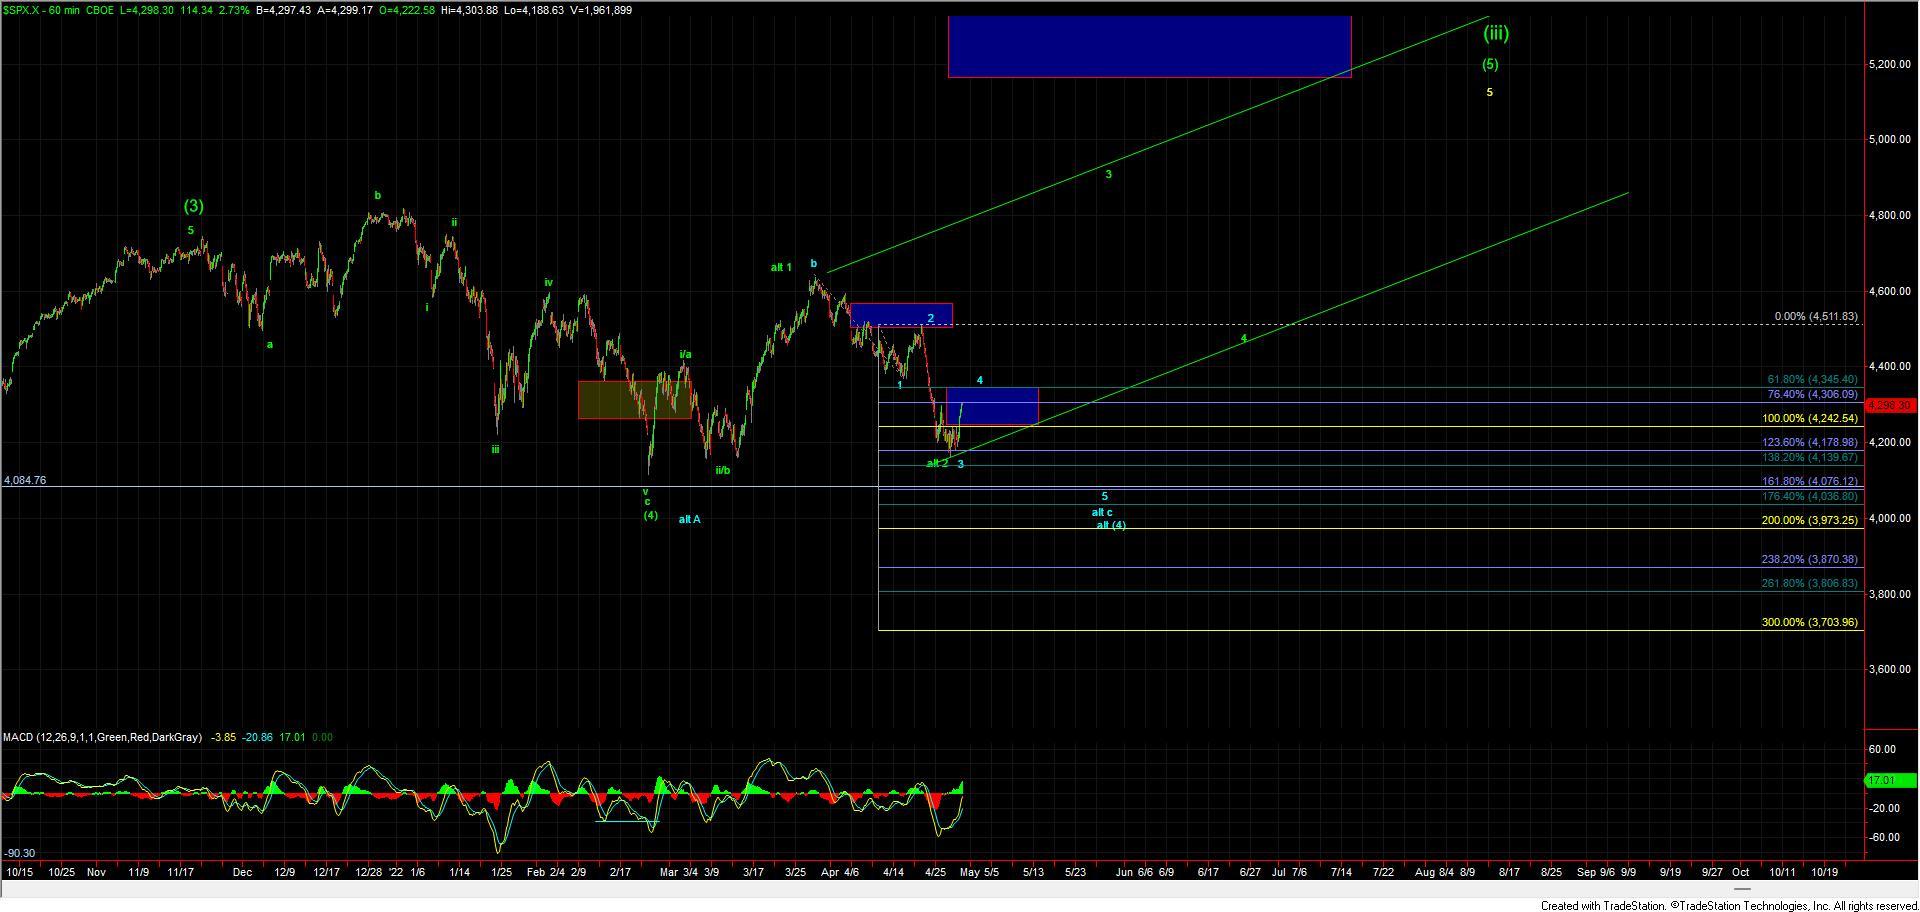
Today the market found a local bottom and break from the strong selling that we have seen over the past several days and has pushed sharply higher with the SPX up close to 3% on the day. Although this rally is quite strong the market has still yet to clear some very key resistance levels thus still leaving the market in a precarious spot as the downside pattern still is looking incomplete. So while we may have seen a break in the selling today as long as this remains under the key overhead resistance we still may see at least one more lower low to finish off the larger degree wave (4) before a significant bottom is seen as has been laid out in the blue count on the charts.
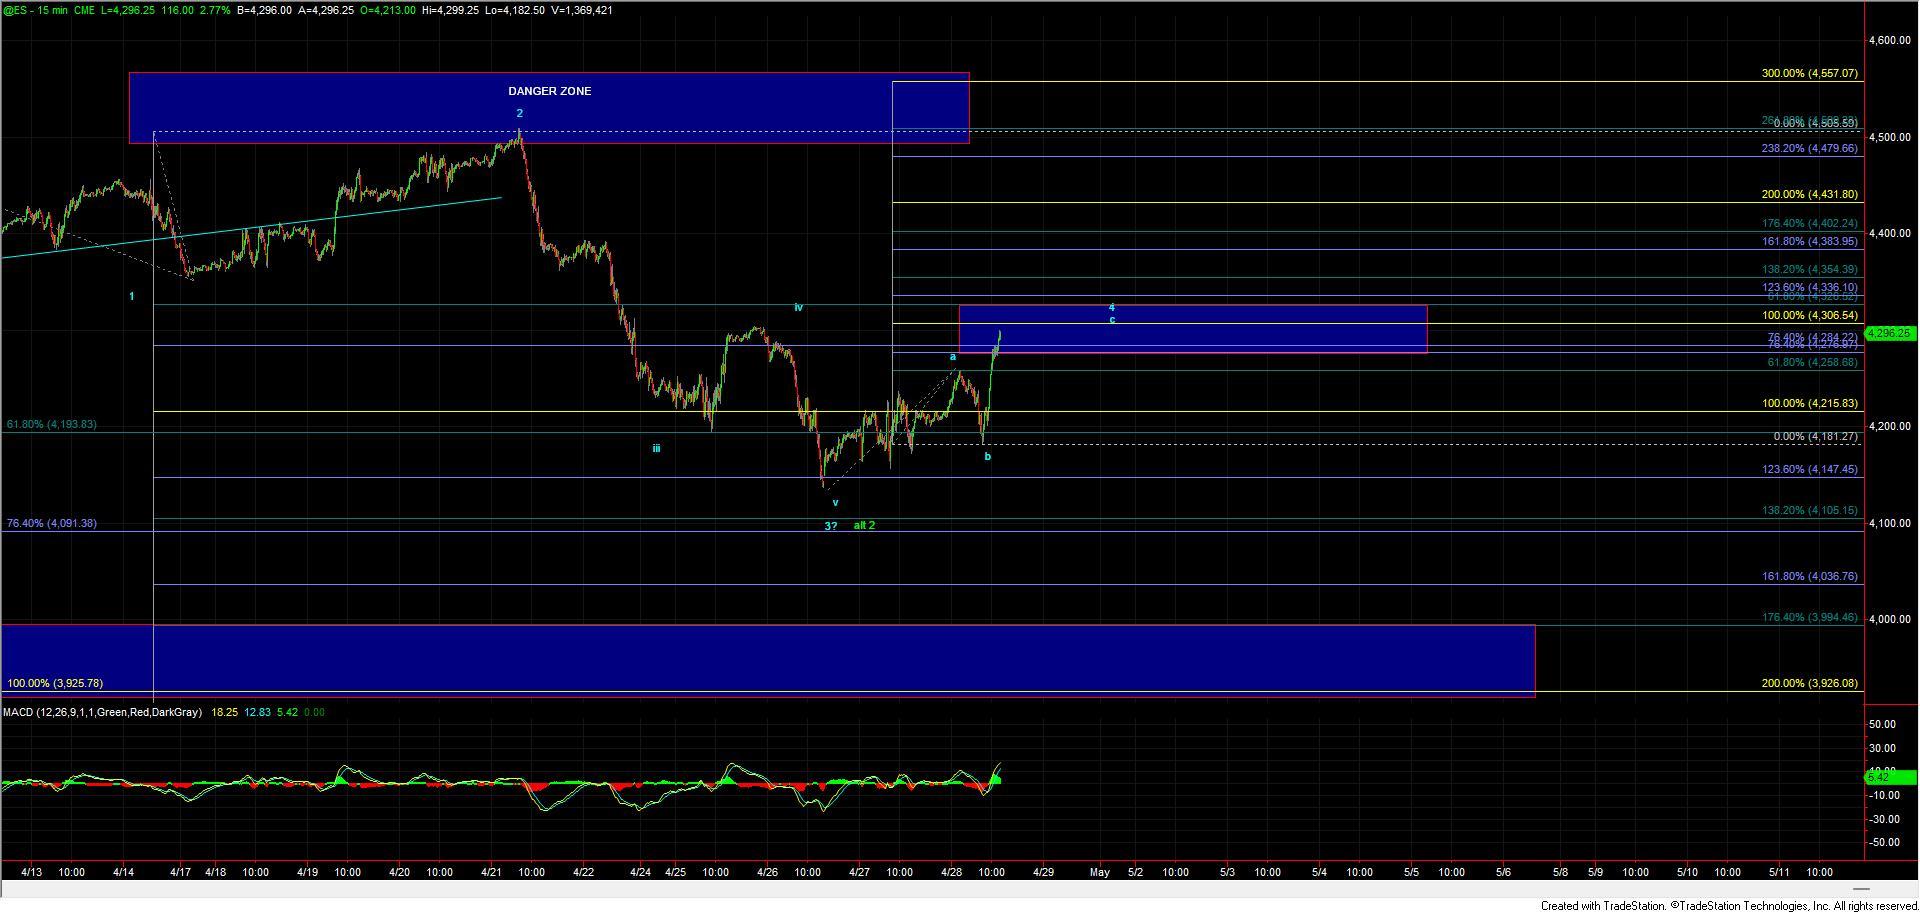
Under this blue count the rally today would count as a wave 4 or that wave c of (4) still needing yet another lower low to finish off the wave 5 of c of (4) down towards the 4000 region. Standard resistance for this blue count comes in at the 4306-4345 zone which we are currently in. Should we see a break back over that zone then it would open the door for this to have put in a bottom in the alternate wave 2 shown in green. I will note however that even with a push over that resistance zone I still would remain somewhat cautious as it is certainly possible that this wave c of (4) down could morph into an ending diagonal. This ending diagonal count would actually fit better with what I am seeing on the other equity charts, however, a push up through resistance would certainly take some downside pressure off in either of these scenarios as it would mean that even with a lower low for the wave 5 of c. That wave 5 would then likely bottom higher than if this is following the impulsive path down to new lows.
If we are able to break over resistance and follow that up with a break over the 4380 and then 4430 level then the green wave 2 bottom would become much more likely. I will note that although this green count would signal that a bottom is in place the path to new highs, under this count would be very sloppy and difficult to track as it would be following a very larger ending diagonal up off of the lows. Furthermore, this green count does not fit well with the Nasdaq or Russell 2000 so I do think that it is less probable at this point in time.
So as I noted above while this rally is certainly giving us a nice break from the downside pressure today unless this is really able to see continued follow-through higher over the resistance the pattern is still suggestive of seeing yet another lower low before we can call the larger degree pattern completed so caution is still warranted. Today's rally is certainly a good start to the larger degree bottoming process that needs to take hold for the market to find that ultimate bottom before pressing to new highs once again.