Market Pushing The Edge Of A Breakout
 By
By
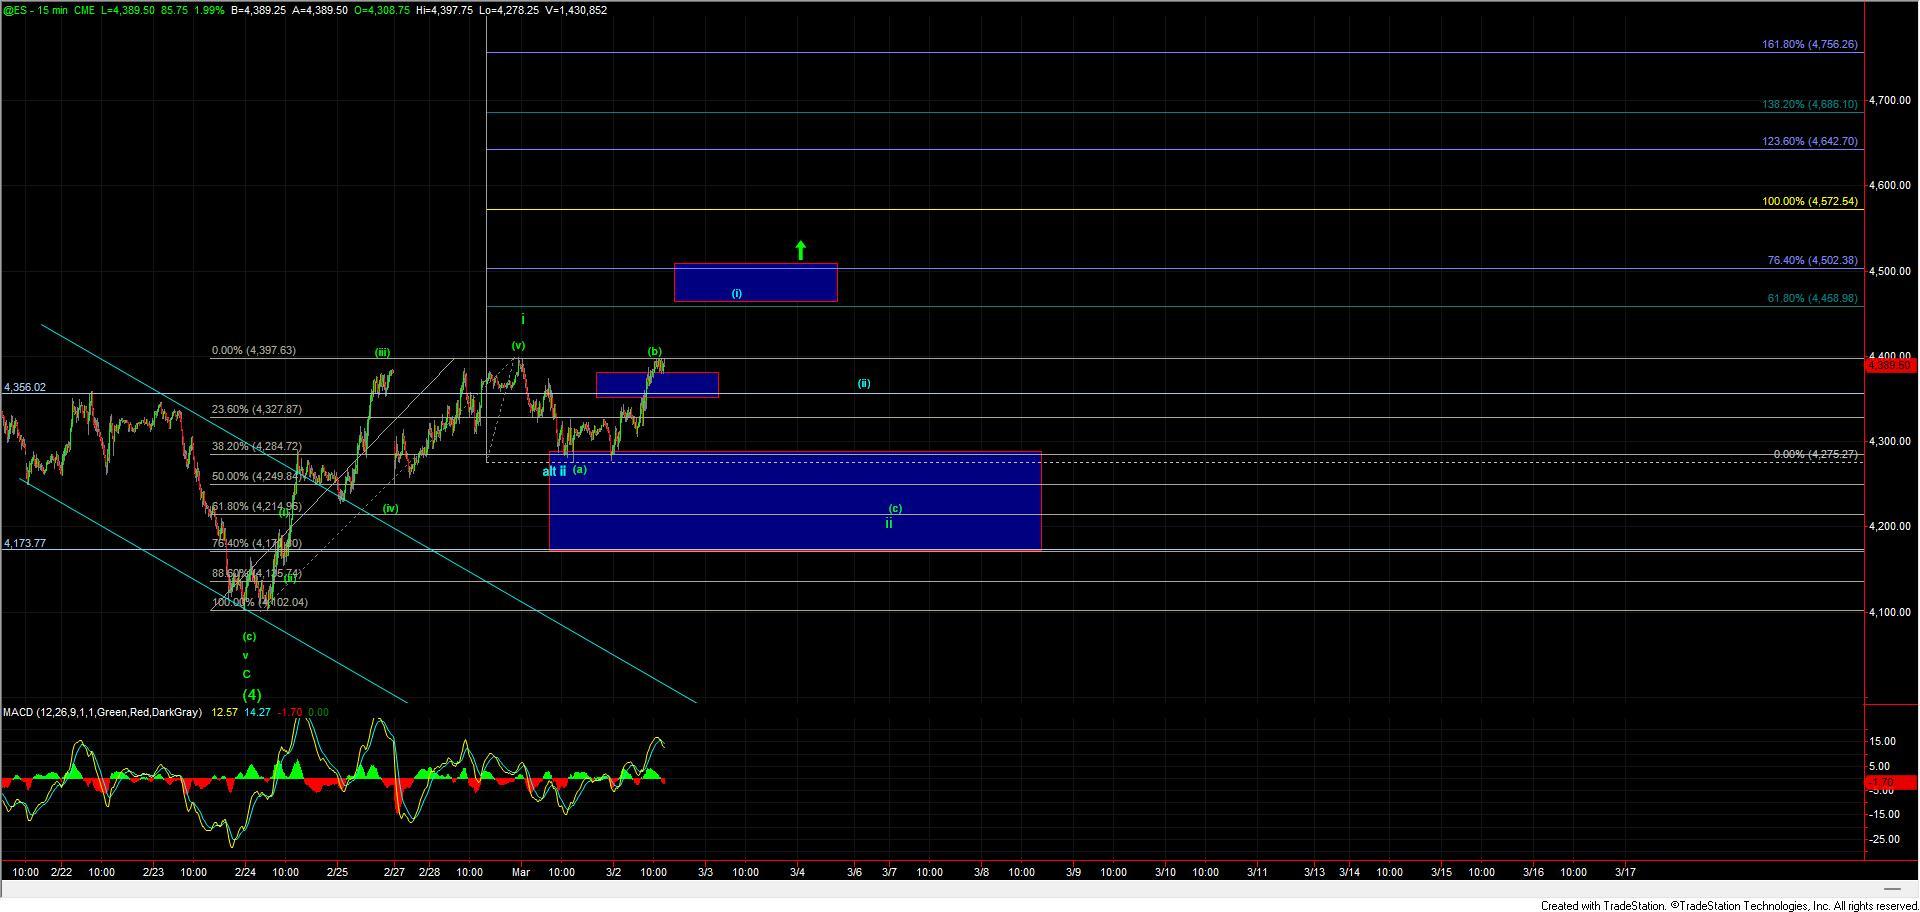
Today we saw the market push to the edge of the previous highs at the 4397 level on the ES opening the door for the market to have already put in a bottom in the wave ii pullback that we had been watching over the past several days. We have however yet to see the market make a clean break over those levels and the wave structure off of the lows is still only three waves. So with that and until we can actually breakout to new highs and get a full five wave move up off fo the 4275 level we still do not have confirmation that we have begun the breakout for the wave iii just yet and I am still giving the green count the slight edge here. If we do break out to new highs it would however shift the odds to the blue count with further confirmation coming once we see a full five wave structure formed off of the 4275 low.
Under the green path we should ideally hold under the 4397 high and then see a five wave move lower to start the wave (C) of ii. Now I will note that because we are dealing with a potential b wave we can see a push over that 4397 high and not technically invalidate the b wave as long as we do so on three waves. This is however not a terribly reliable pattern but it would still remain technically valid. If we do break lower then with the high wave (B) we likely would be looking at a fairly flat wave structure with the wave (C) of ii ideally hitting one of the higher support fibs near the 4249-4213 levels before turning higher and beginning the wave iii up with a full five up off of one of those fibs as the initial signal that a bottom has indeed been struck.
If this does not turn down but rather continues to push higher then we would be looking towards the blue count under which case we should see a full five up off of the 4275 level pushing this towards the 4458 area before seeing a smaller degree top in the wave (i) of of the larger wave iii. This would then make the next upside pivot come in at the 4458-4502 zone and moving through that zone would give us firm confirmation that we have indeed begun the heart of the wave (III) of iii up. The pullback for the wave (II) of iii would potentially provide us with one more opportunity to add to positions before this really begins to breakout strongly in the heart of the wave (III) of iii up. I would however not be surprised if that wave (II) pullback is rather shallow as this is fairly common in these nested 1-2 setups. With being able to place stops for that setup under the 4275 low however the risk to reward on this potential trade would however still be quite good.
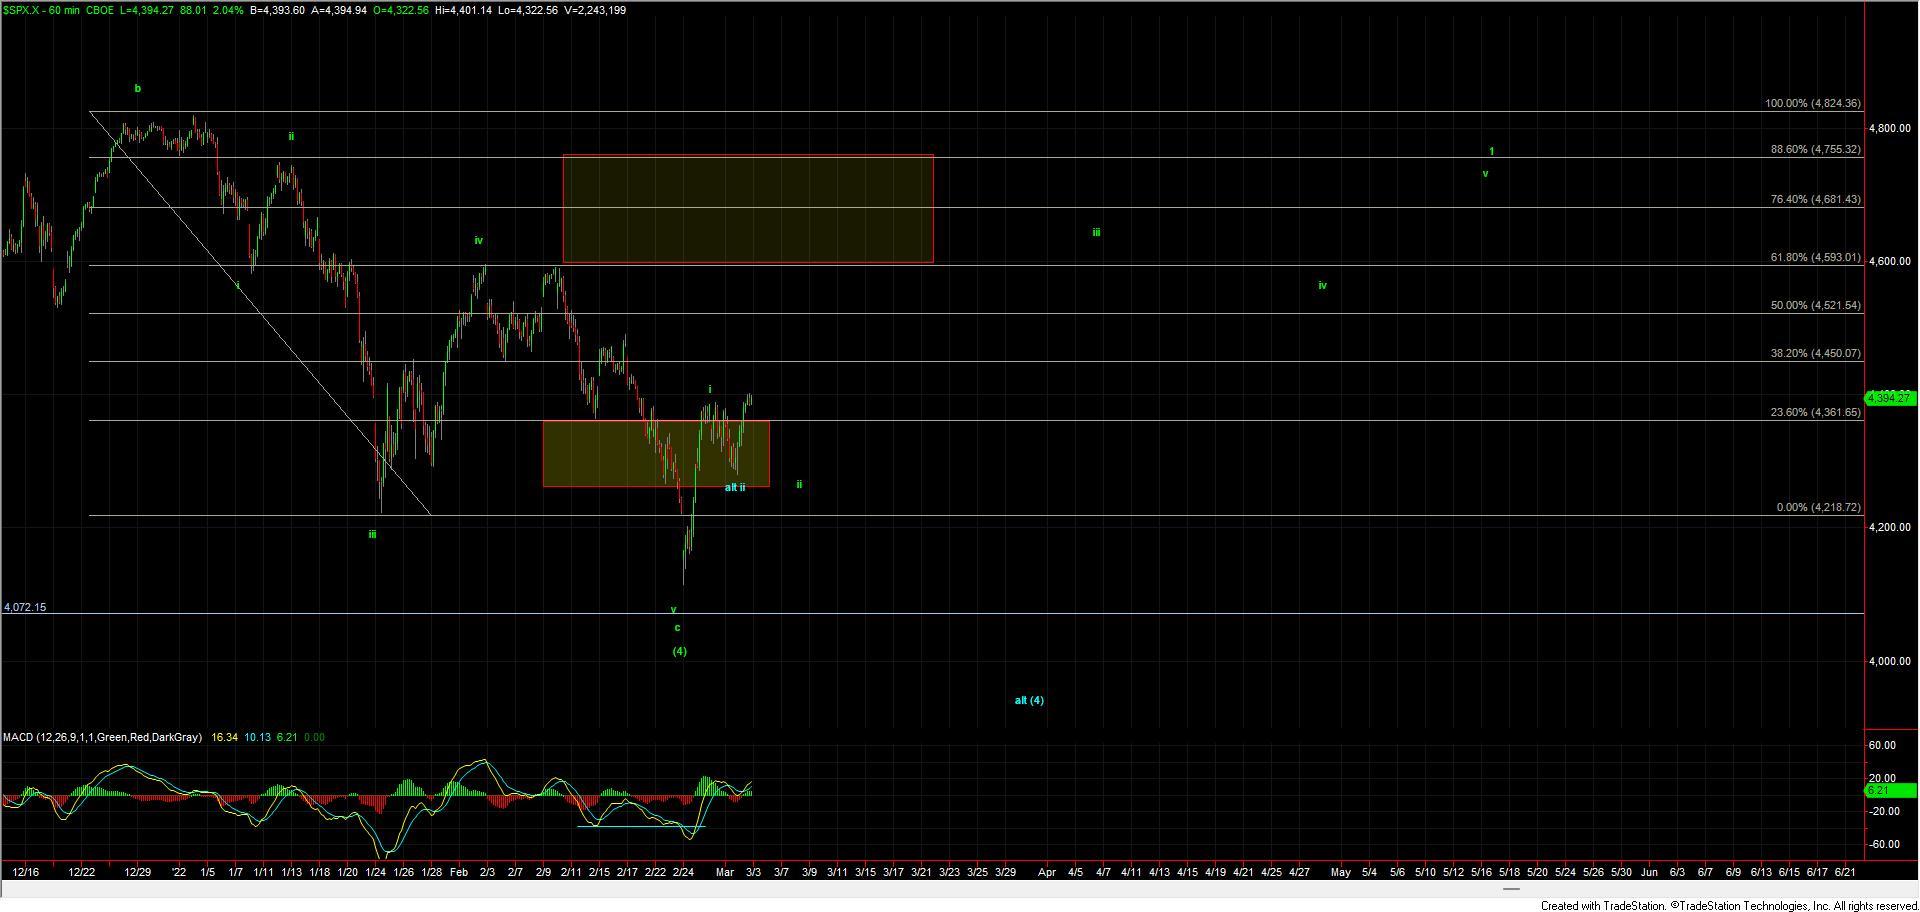
So although the "news" is still not getting any better, the market is still following the pattern that we have been laying out over the past several days and is so far taking advantage of the pullback opportunity. Whether we get a deeper pullback for that wave ii is still a bit up in the air but in either case, the structure is still very much arguing that a bottom has been struck in the larger degree wave (4) leaving plenty of room to the upside in the coming months. It is during these times when we see the market follow impulsive wave patterns and move in opposition to what the "news" would suggest is where the opportunities are the greatest and where following the sentiment tracking Elliott Wave and Fib Pinball truly shine.