Market Pushes Us To The Limit
We use our Fibonacci Pinball method to provide more structure to the Elliott Wave patterns we follow. And, when the market begins to break through the standard turning points identified within Fibonacci Pinball, it is an early warning that an impulsive structure may very well fall apart.
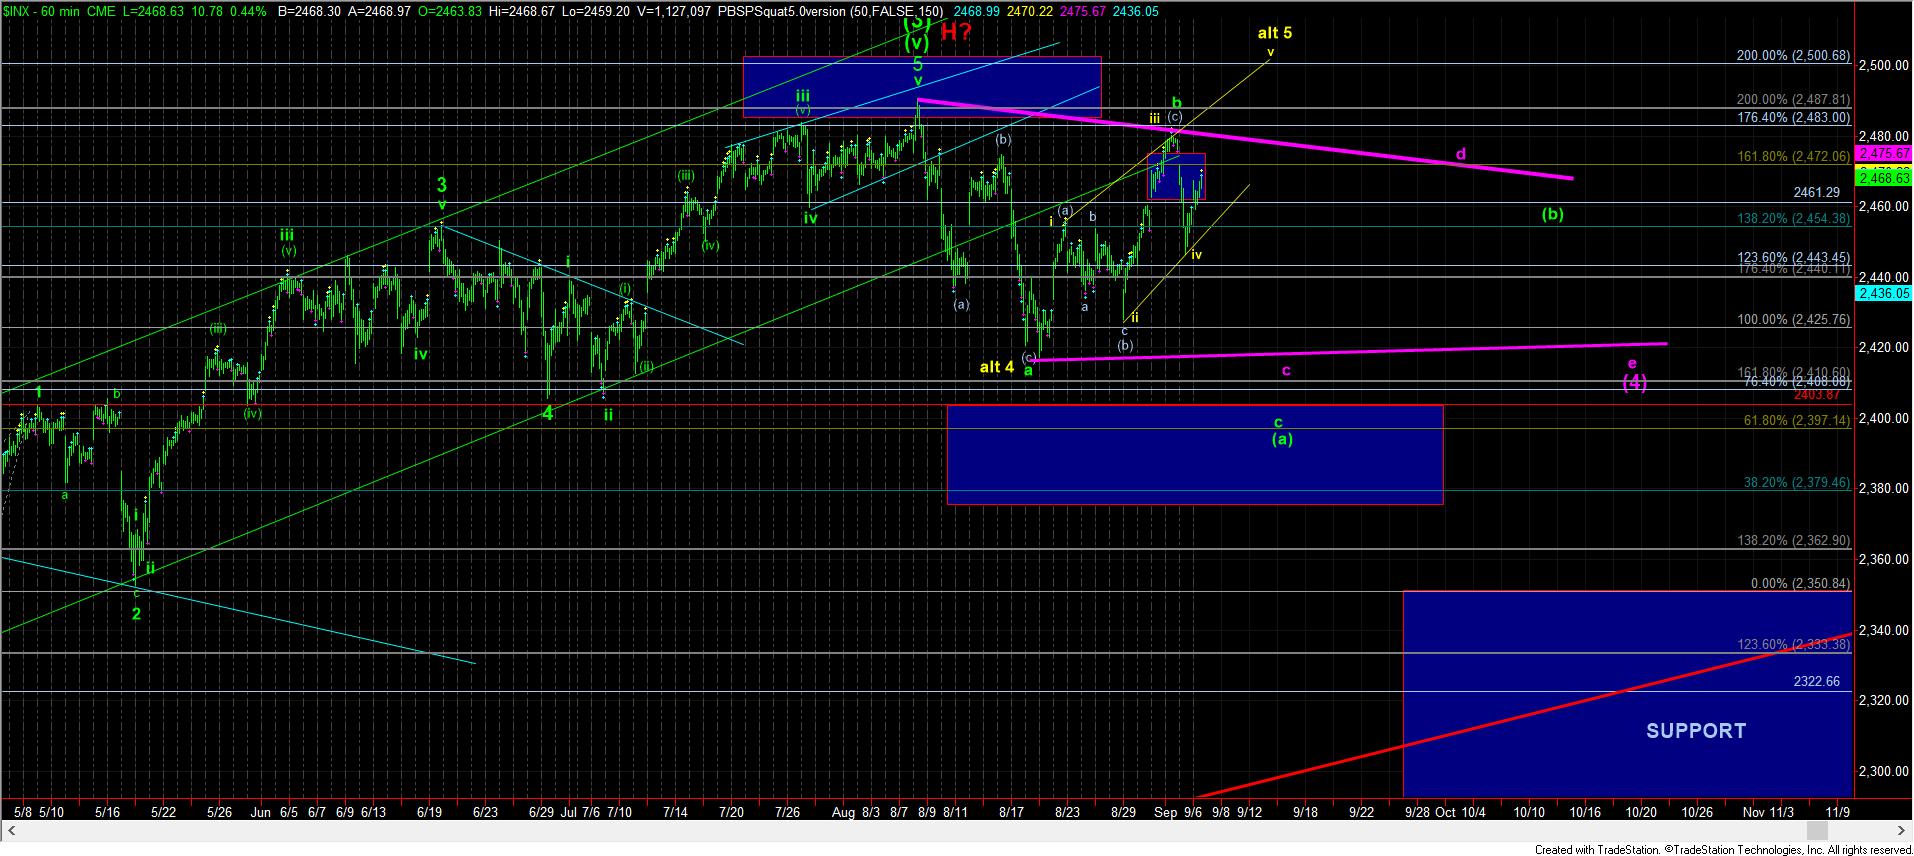
Yesterday provided us with the perfect example. As we followed the market down to where a wave iii of 3 would normally target (1.236 extension), Fibonacci Pinball suggests that wave iv of 3 should generally not exceed the .764 extensions, which was in the 2456 region. But, when it moves through the .618 extension, it strongly suggests that the pattern will not likely continue within the impulsive structure. And, as noted yesterday, that .618 extension was in the 2460 region. So, true to form, the market reversed higher today, for which we had been given some advance warning.
But, this reversal has now placed us in a precarious position, as the market has now clouded its near-term intention. Ideally, yesterday’s decline should have continued lower to complete the c-wave of the green (a) wave. But, it did not. While this rally today may still be a wave 2 within that c-wave down, the technicals seen in the decline yesterday are not wholly supportive of that potential. Yet, I simply cannot discount that potential, as long as we remain below 2472SPX. The target for a c-wave taking hold from up here is pointing directly to our ideal target region we wanted to see in the 2380 (2.618 extension of 1-2 down)-2400SPX (2.00 extension of 1-2 down) region.
And, as I also noted yesterday, should we see a move higher today, it could also mean that the market MAY form a triangle for this wave (4), which is presented on the 60-minute chart in purple. It means that, should the market continue lower for the remainder of this week, it can hold the lower purple trend line in the 2420SPX region to complete the c-wave of this triangle. And, should we continue lower, this can become a strong potential, and we will need to be very aware of where resistance is on our way down.
Lastly, if the market is unable to maintain below the 2472/73 resistance overhead, it opens the door to the potential that the yellow ending diagonal may play out to take us to the 2500-2510SPX region. This is a much higher probability if we break out over last week’s high at 2480SPX.
So, as long as 2473SPX is held as resistance, pressure will remain to the downside. Between 2473-2480 is a bit of no-man’s land, but the probabilities start moving towards the yellow count. And, should we break out over 2480SPX, then I will likely adopt the yellow count as my primary.
While we are in a region that has provided us more questions than answers at this time, at least we have guidance from the various levels I have noted above. So, for now, I am in a wait and see mode, but my true preference would be to continue to look lower this week. Yet, the market may have other ideas, and I will have to listen as Mr. Market talks.