Market Pushes Lower but Continues to Hold Key Support
 By
By
We saw the market move lower overnight, retrace that entire move in the early morning, and then roll over sharply once again. As of this writing, we are sitting just above key support, which keeps both the bullish and bearish counts alive for now. As we have been noting over the past several sessions, the price action in this region has been extremely sloppy, making it difficult to lean too heavily in either direction.
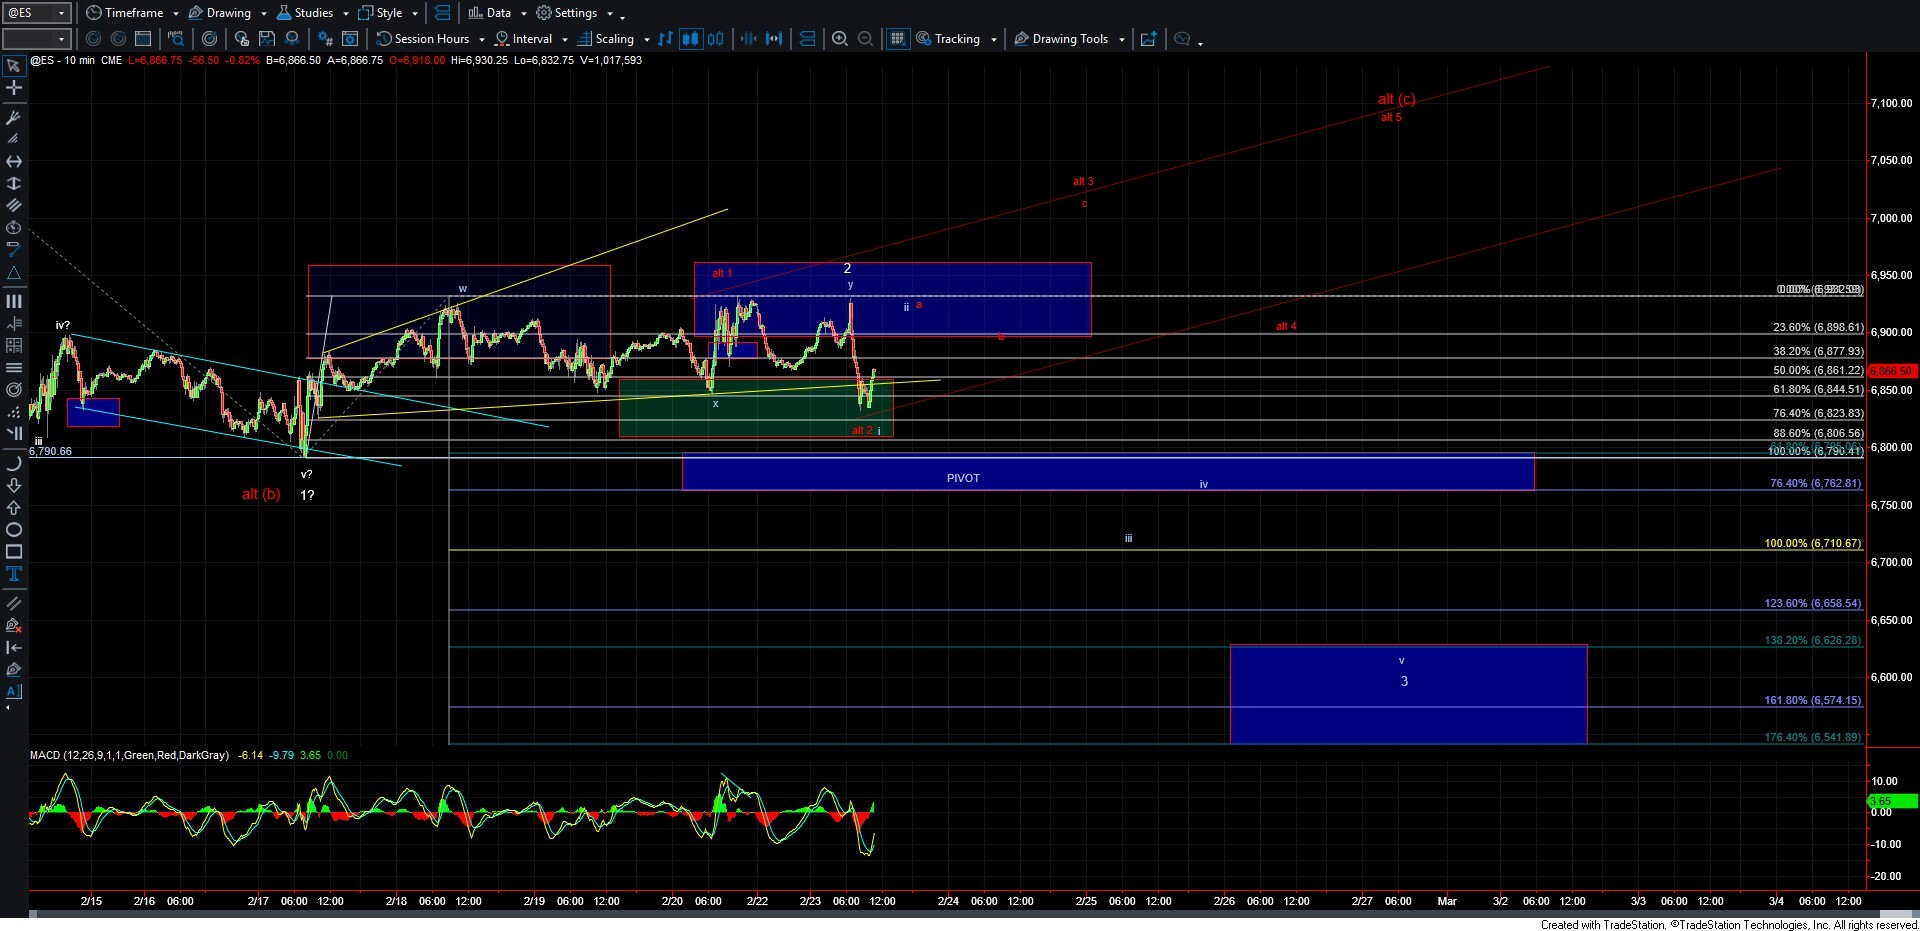
Adding to that uncertainty is what I am counting as a somewhat incomplete topping structure for the potential wave 2. That lack of ideal structure reduces confidence in the bearish white count, though it does not invalidate it. For now, as long as we remain above the 6791 low and below the 6931 high, both counts remain valid and in play.
While I am still leaning toward the white wave 2 topping scenario, my confidence is not as strong as it was at the end of last week. That said, the bullish path to new highs is not without its own structural issues. It remains viable as long as we continue to hold above 6791 and ideally above 6806.
At this point, I am tracking only the red, larger Ending Diagonal as the primary bullish alternative. The yellow Leading Diagonal count has been invalidated on the ES and previously on the Nasdaq, though it does technically remain valid on the SPX. Without confirmation from the ES and Nasdaq, however, the red Ending Diagonal is the more likely bullish scenario in my opinion.
Because the red count is structured as a larger Ending Diagonal, we do not necessarily need to see a five-wave move to the upside for it to remain valid. That will make confirmation more nuanced, and we will need to closely monitor the structure of the next pullback after a local bottom forms. A direct break above the 6930 high would, however, confirm the bullish scenario and suggest that we are heading higher into at least the early part of March.
On the other hand, a break below the 6791 low would give us initial confirmation that we are following the white count and are likely in wave 3 to the downside. Further confirmation would come with a break under 6762, at which point 6710 becomes the next key support pivot below.
Until we see a decisive break either below 6791 or above 6930, we remain in a bit of no-man’s-land. In the meantime, we will need to let the internal wave structure guide us. Without a break of one of those two levels, it will remain difficult to have a high degree of confidence in which of these counts the market ultimately resolves toward.