Market Pushes Higher But Is Still Sitting Under Key Overhead Resistance
 By
By
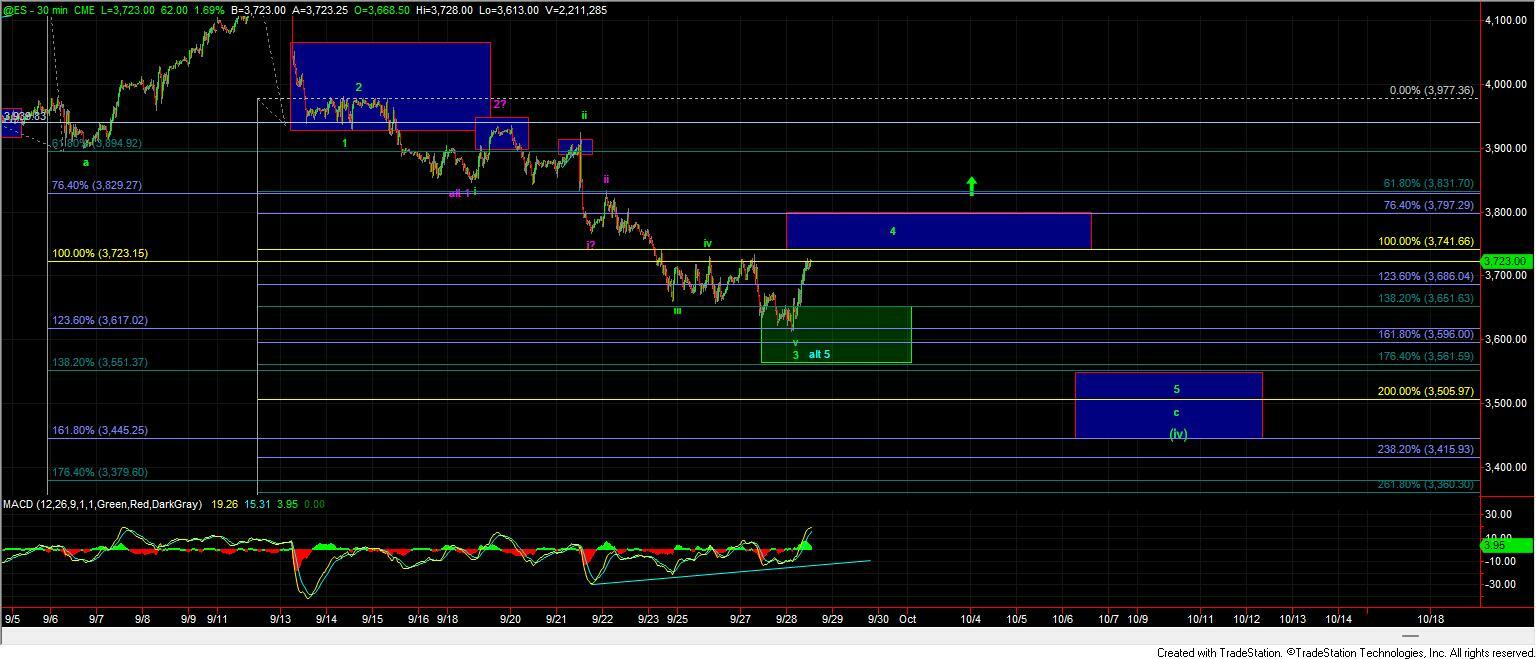
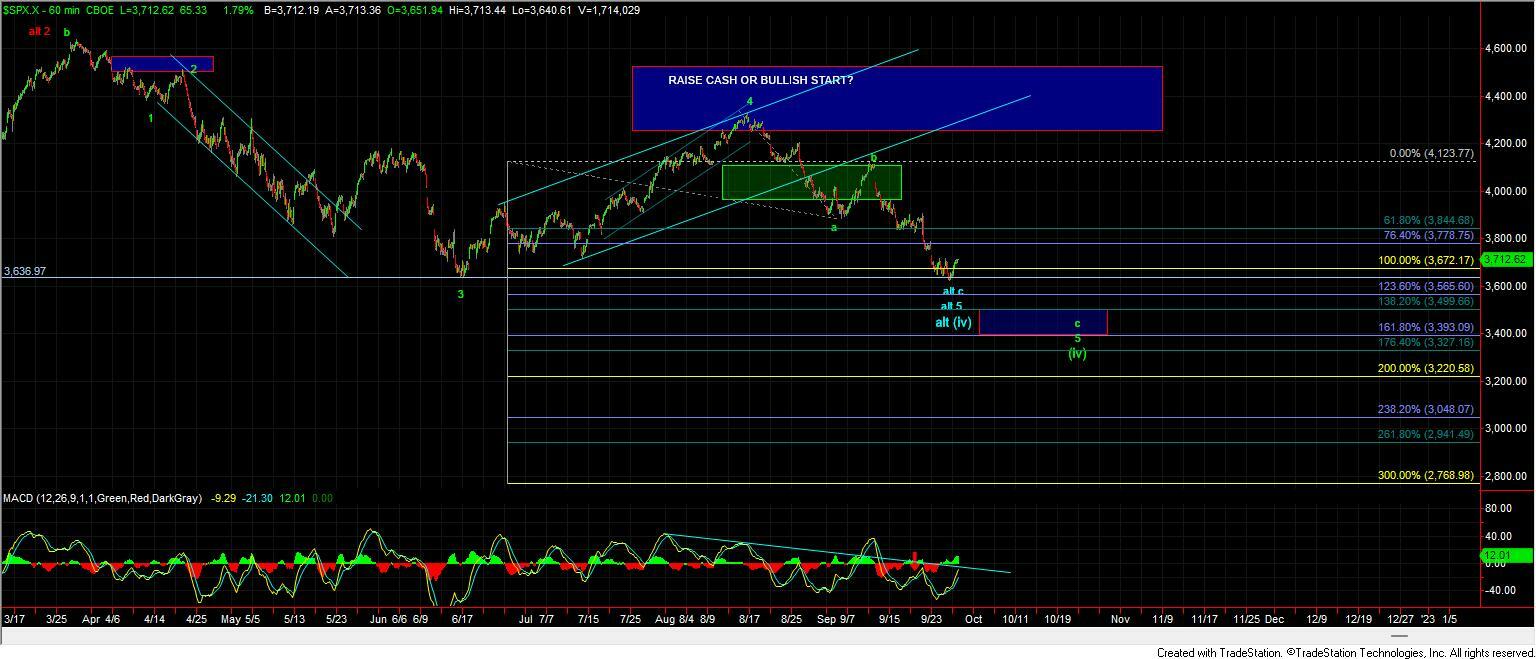
After moving down into the ideal target zone for the wave 3 of c overnight and early this morning we saw the market push sharply higher with the ES up over 1.5% at the time of this writing. Although the move up is quite sharp we do still only have three waves up off of the lows and the pattern to the downside still counts much better as an incomplete three-wave move rather than the five that we need to finish off a wave c. So with that and as long as we are trading under the ideal resistance zone for our potential wave 4 down off of the 4172 high the ideal pattern still would look better to see yet another lower low to give us a full and complete wave c down. If we see resistance break over the next couple of trading sessions however then it would give us an initial signal that we may have indeed struck a bottom in all of the wave c and are ready to begin the next leg higher.
Green Count
Under this count, we should now hold the 3741-3797 zone overhead and then break back down below the lows that were struck overnight at the 3613 level. After breaking then we have the next key fibs below at the 3551-3445 zone below which represents the 138.2-161.8 ext of the wave a down off of the August highs. From that point, we would then want to see a push back up over the 3797 level to give us confirmation that we have indeed put in a bottom in the wave 5 of c. If we are able to break out over that 3797 level prior to breaking down to a new lower low then it would give us the initial signal that we may have already bottomed in all fo the wave 5 of c of (iv) as shown by the blue count.
Blue Count
The blue count is the same as the green count except it just suggests that we have already put in a bottom in all of the wave 5 of c of (iv). While far from ideal as the move down into the lows still very much counts better as only being three waves so far if we are able to break out over the 3797 then I would allow for all of the wave 5 of c to be completed at the overnight low.
Purple Count
I am leaving this purple count on the charts for now however based on how the price has reacted at the fibs I think this count is much less likely at this point in time. This count would ultimately move deeper than the green count as the initial wave 1 would be larger than the red count but again I am viewing this as a lower probability path at this point in time.
Overall this continues to follow our fib pinball guidelines very well as part of an impulsive wave c into the current levels. I will reiterate however that as we approach the final stages of this move, the easy part of this price action is likely over and the final fourth and fifth waves of this are going to be a bit more difficult to predict. That being said we do have fairly clear parameters to watch here and as long as we continue to trade within those parameters I have to give the benefit of the doubt to the most probable path which is still suggestive of seeing yet another lower low before this move is completed.