Market Pulls Back But Still Trading Inside The Boxes
 By
By
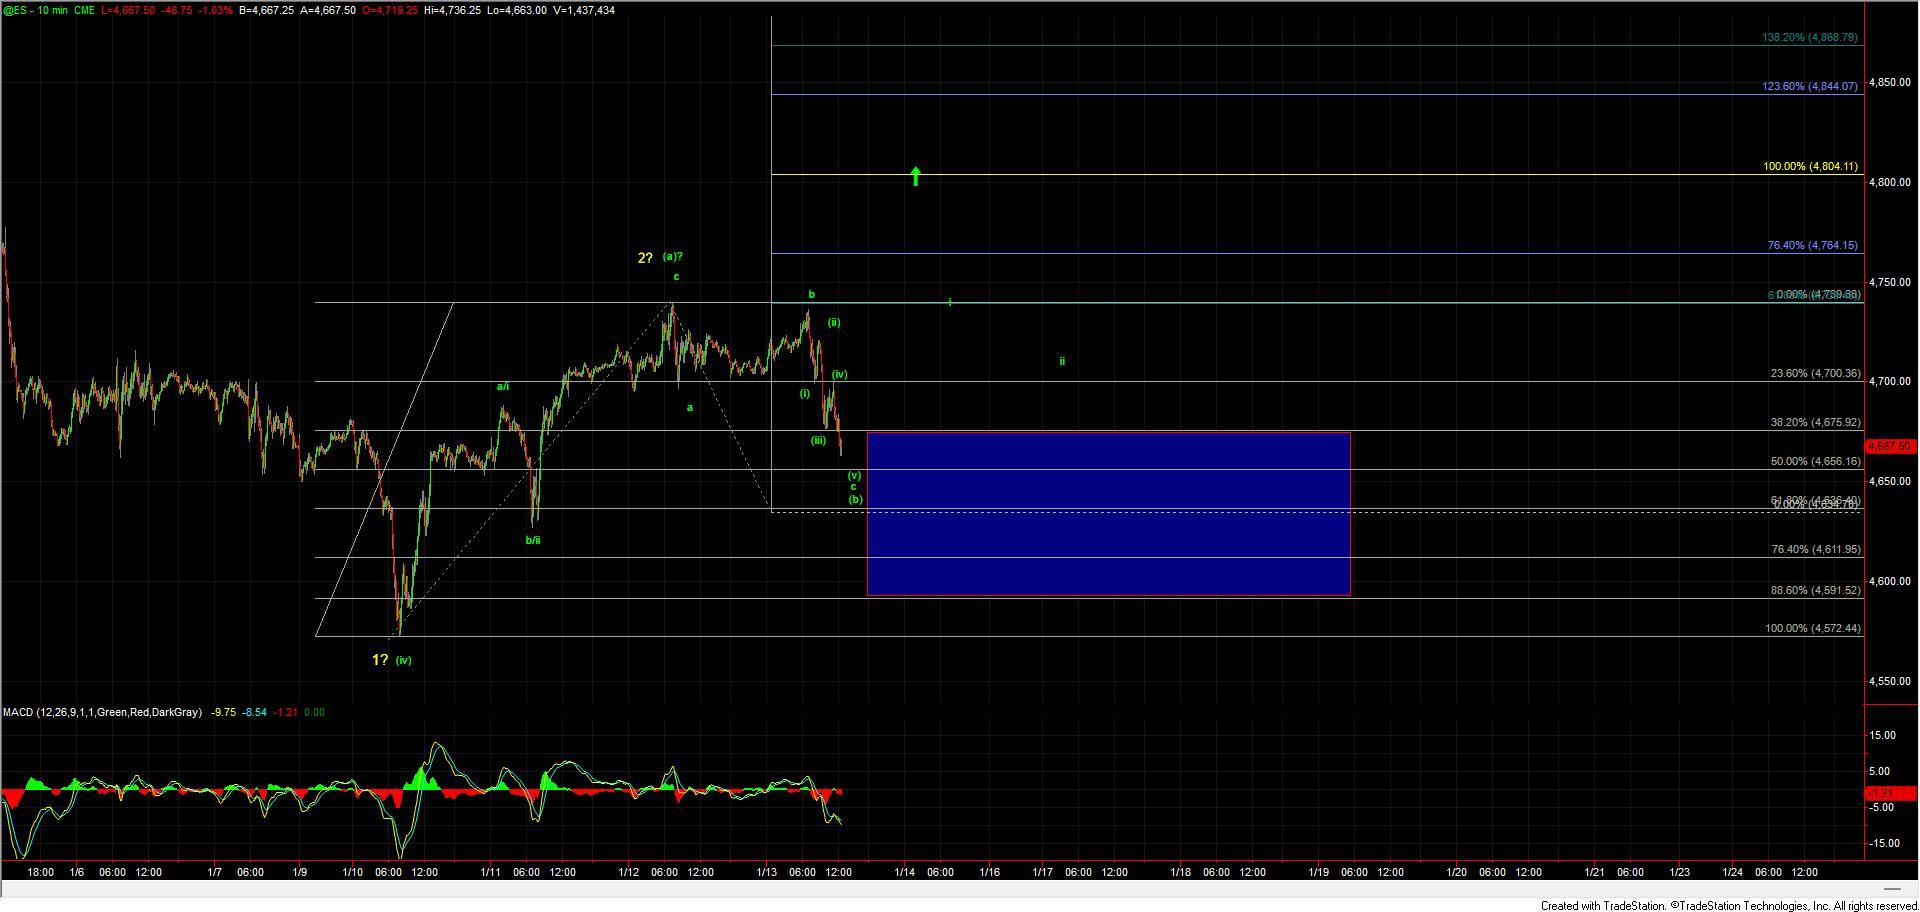
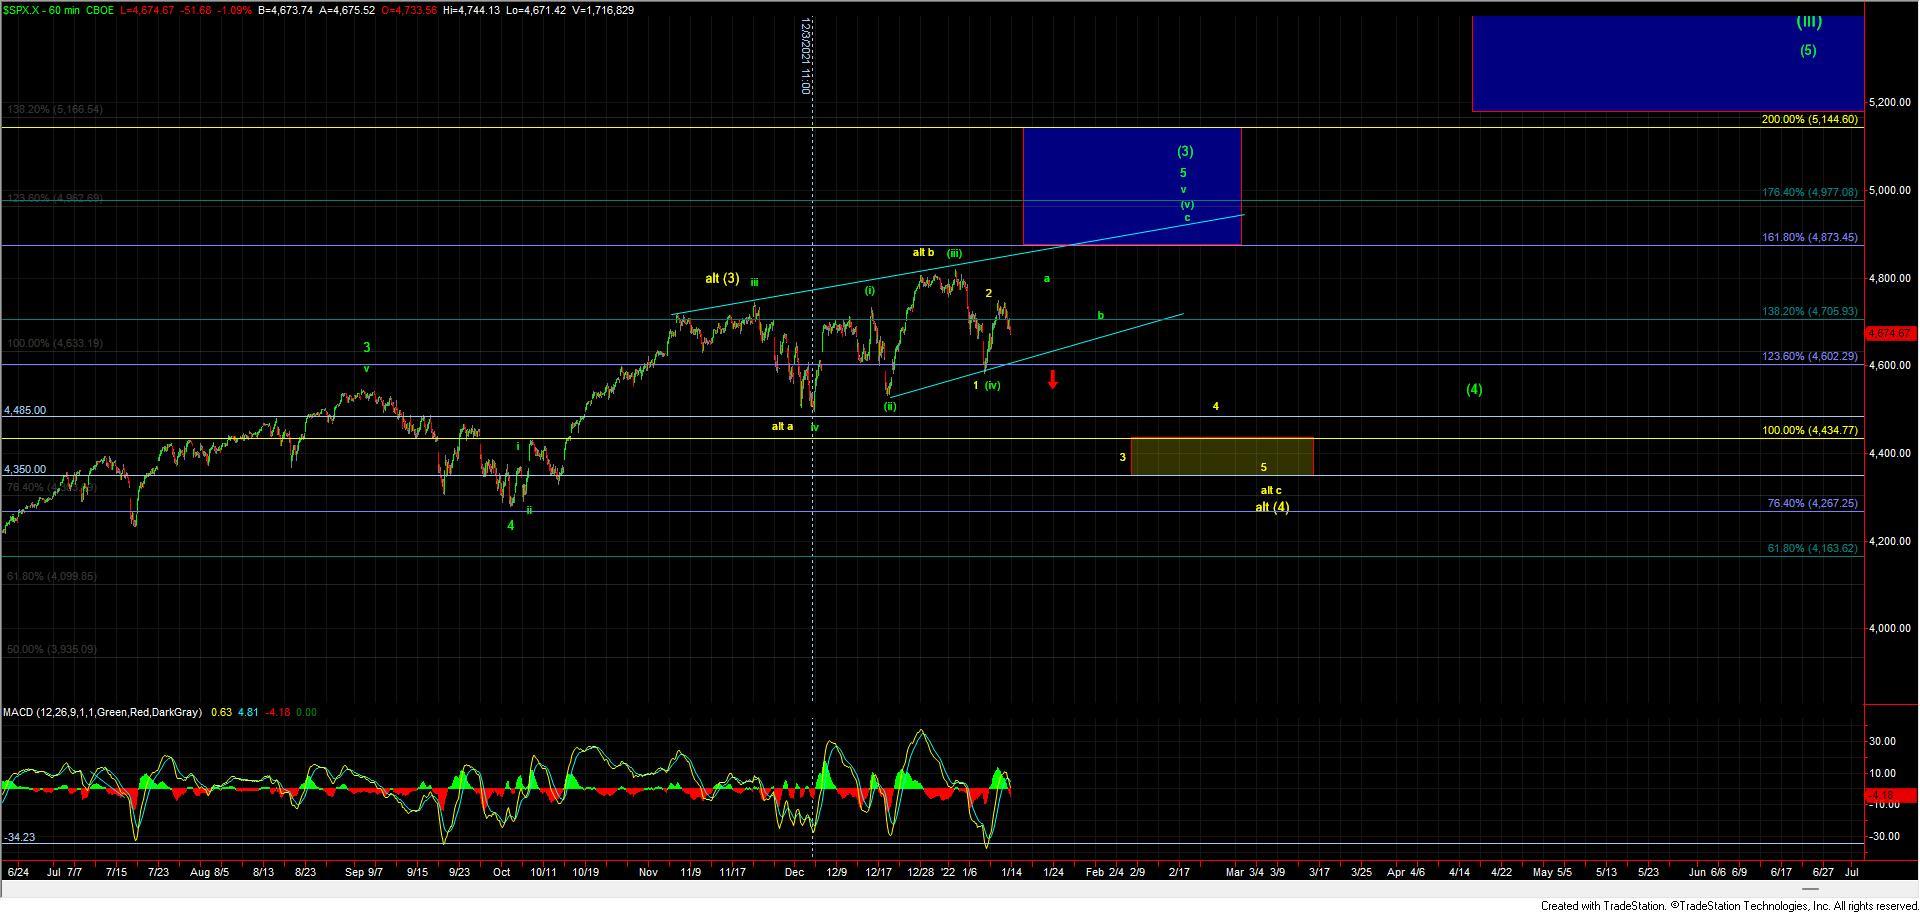
After topping yesterday and giving us a very flat consolidation pattern we saw the market take a dip lower in what is so far counting quite well as a corrective wave c down off of the morning high. This push lower was the preferred path as the support zone for the wave (b) comes in at the 4675-4591 zone, the upper end of which we hit today. The action and wave subdivisions down into the upper end of this support zone have been quite sloppy and a bit difficult to track however so far the larger degree pattern does seem to be tracking the expected path fairly well and inside of our support and resistance boxes. When we see the market bounce off of and hit its head on these support and resistance levels it is a good signal that we are indeed following the correct path. Of course, that path which we have laid out is shown in green on the charts and is suggestive that we should be close to finding a local bottom on our way up to new highs in the SPX to finish off the larger degree wave (3) as shown on the 60min SPX chart.
Now while seeing the market push to new highs per our green count there is still a reasonable amount of risk in this market given both where we are within the larger degree count as well as the pattern that is presenting itself off of the December 3rd low. The first part of this is rather simple in that the SPX has seen a very strong rally since the lows that were struck in March or 2020 and then again in March of 2021. With that, we are now approaching the standard target zone for what should be the wave (3) of larger wave III off of those respective lows.
The second part of this risk comes with the fact that the price action off of the December 3rd low seems to be taking the shape of an ending diagonal. This makes it far more difficult to accurately project the internal subdivisions of the larger degree wave structure as all of these internal subdivisions (both up and down) take the form of corrective ABC price action rather than impulsive price action. When that occurs we lose our ability to use Fibonacci pinball to give us a more clear and precise framework in which to track the price action. Furthermore, because we are dealing with corrective action to the upside it also leaves the door open to a top already being in place as we have laid out in the alternate yellow count again as shown on the SPX chart.
It is for these reasons that while our primary count is still pointing to another higher high to finish off the larger degree pattern we are still at a spot where it would be prudent to exercise caution as the market works its way higher towards finding a more significant top in the wave (3) as laid out on the SPX chart.
More specifically and on a smaller degree timeframe as Avi noted in the room, due to the lack of high quality set up in the market yet for a higher high to come, you MUST consider that we are heading into a long holiday weekend with low volume futures trading . . so we do not think a HEAVY long conviction is necessary until we get a i-ii upside set up for a (c) wave. I am showing what this may look like on the ES chart but we still need to see a clean five-wave internal wave structure of that wave i to really signal that it is indeed ready to trigger.
So in summary, while this still is following the expected path quite well and we are still expecting higher highs as long as this can maintain over the 4640 level on the ES. Aggressive trading this to the upside with the lack of a clear and clean i-ii up off of the lows is not the most reasonable path forward from here as there is still quite a bit of risk in this market as I have laid out above.