Market On Borrowed Time?
While I am hearing more and more calls for the SPX to now be heading to 3350, I am thinking we are getting close to the end here. Again, while I can always be wrong, and will never be 100% accurate in all my calls, there are so many things pointing to the fact that this high level consolidation is coming to end.
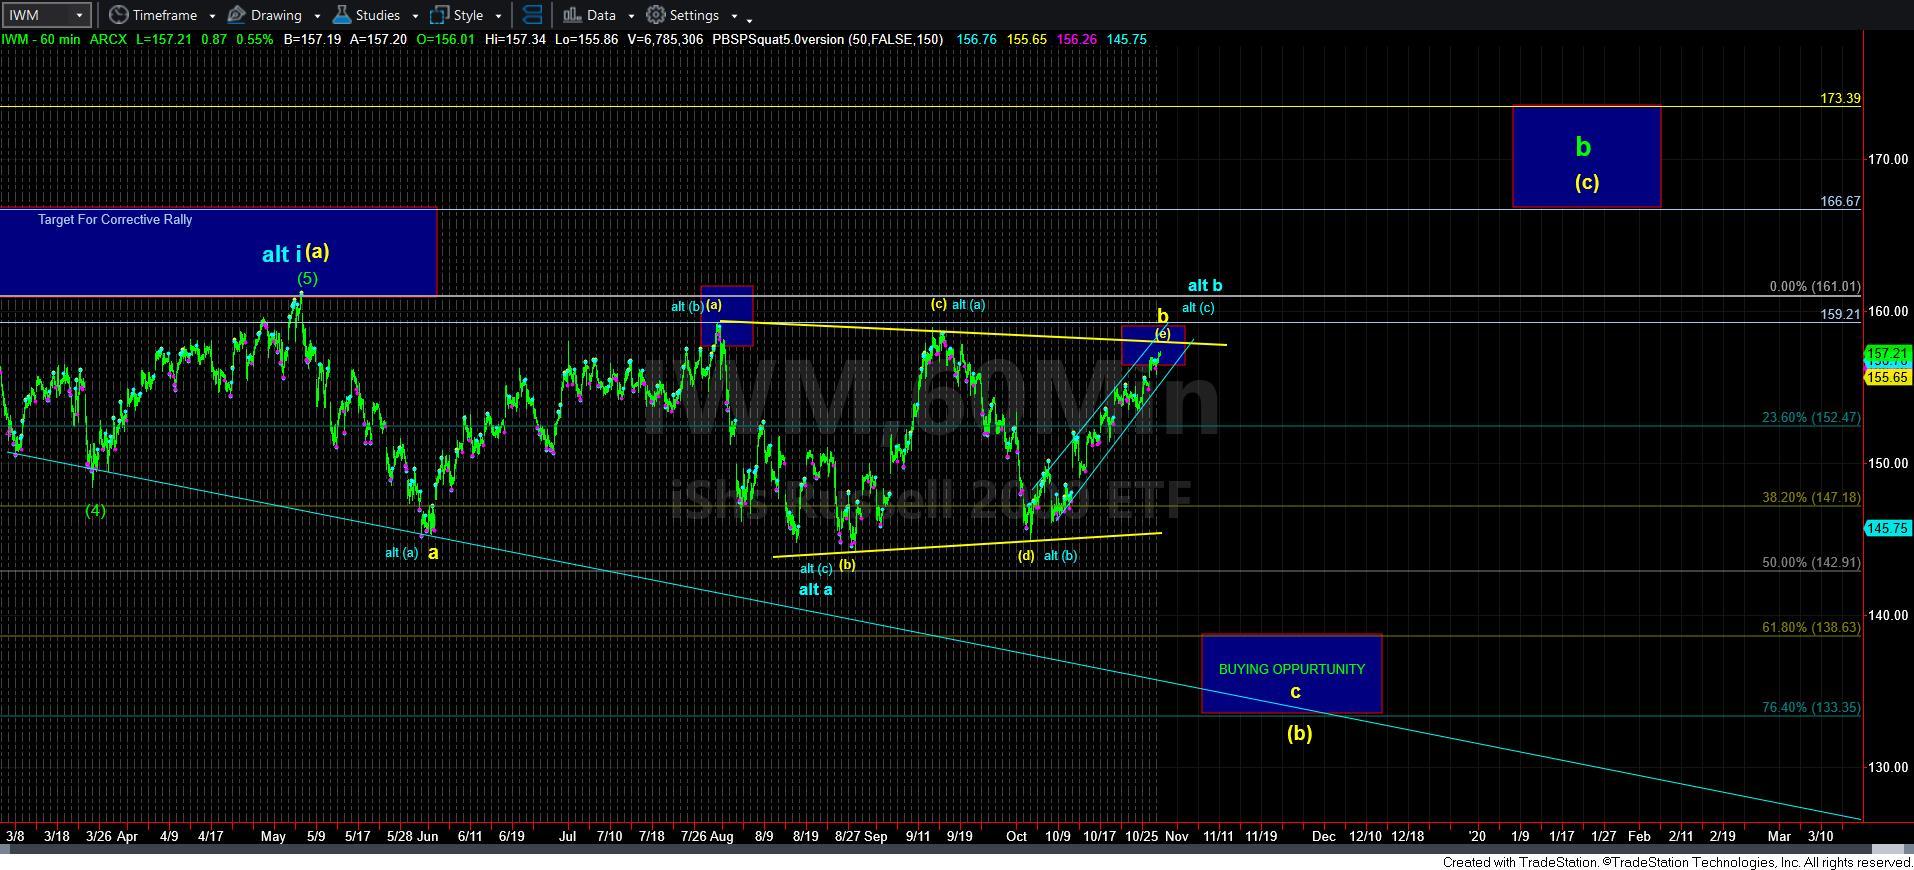
Today, I added an alternative count on the IWM chart. But, I want to note that this truly more academic than anything else. You see, the triangle gets invalidated if we move through 159, but nothing tells me that this is anything other than a b-wave consolidation we have been tracing out now for many months. Both these patterns suggest that we resolve to the downside in a c-wave. So, the only question to me is if the market remains below the [c] wave high of the triangle or not.
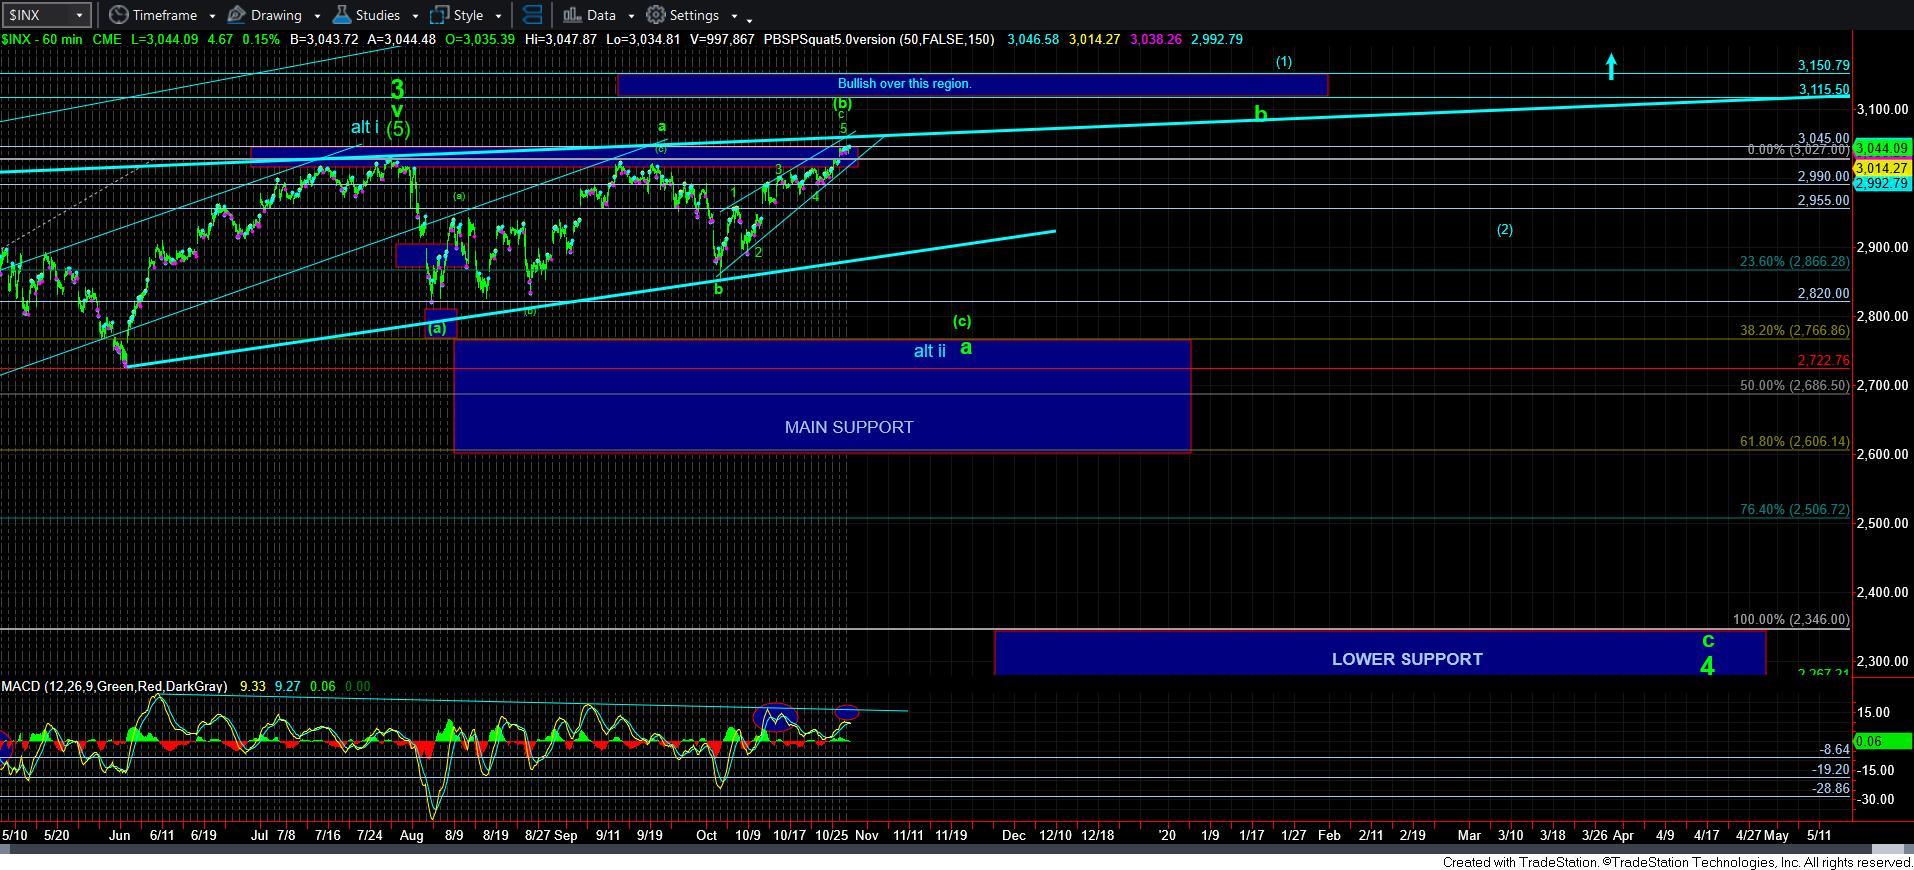
In the SPX, I have been highlighting the MACD on the 60 minute chart. The divergences that have developed since we topped in wave 3 have become quite stark and hard to ignore. In fact, the next time the MACD on this chart turns over, that will tell me that we are likely on borrowed time in this current uptrend.
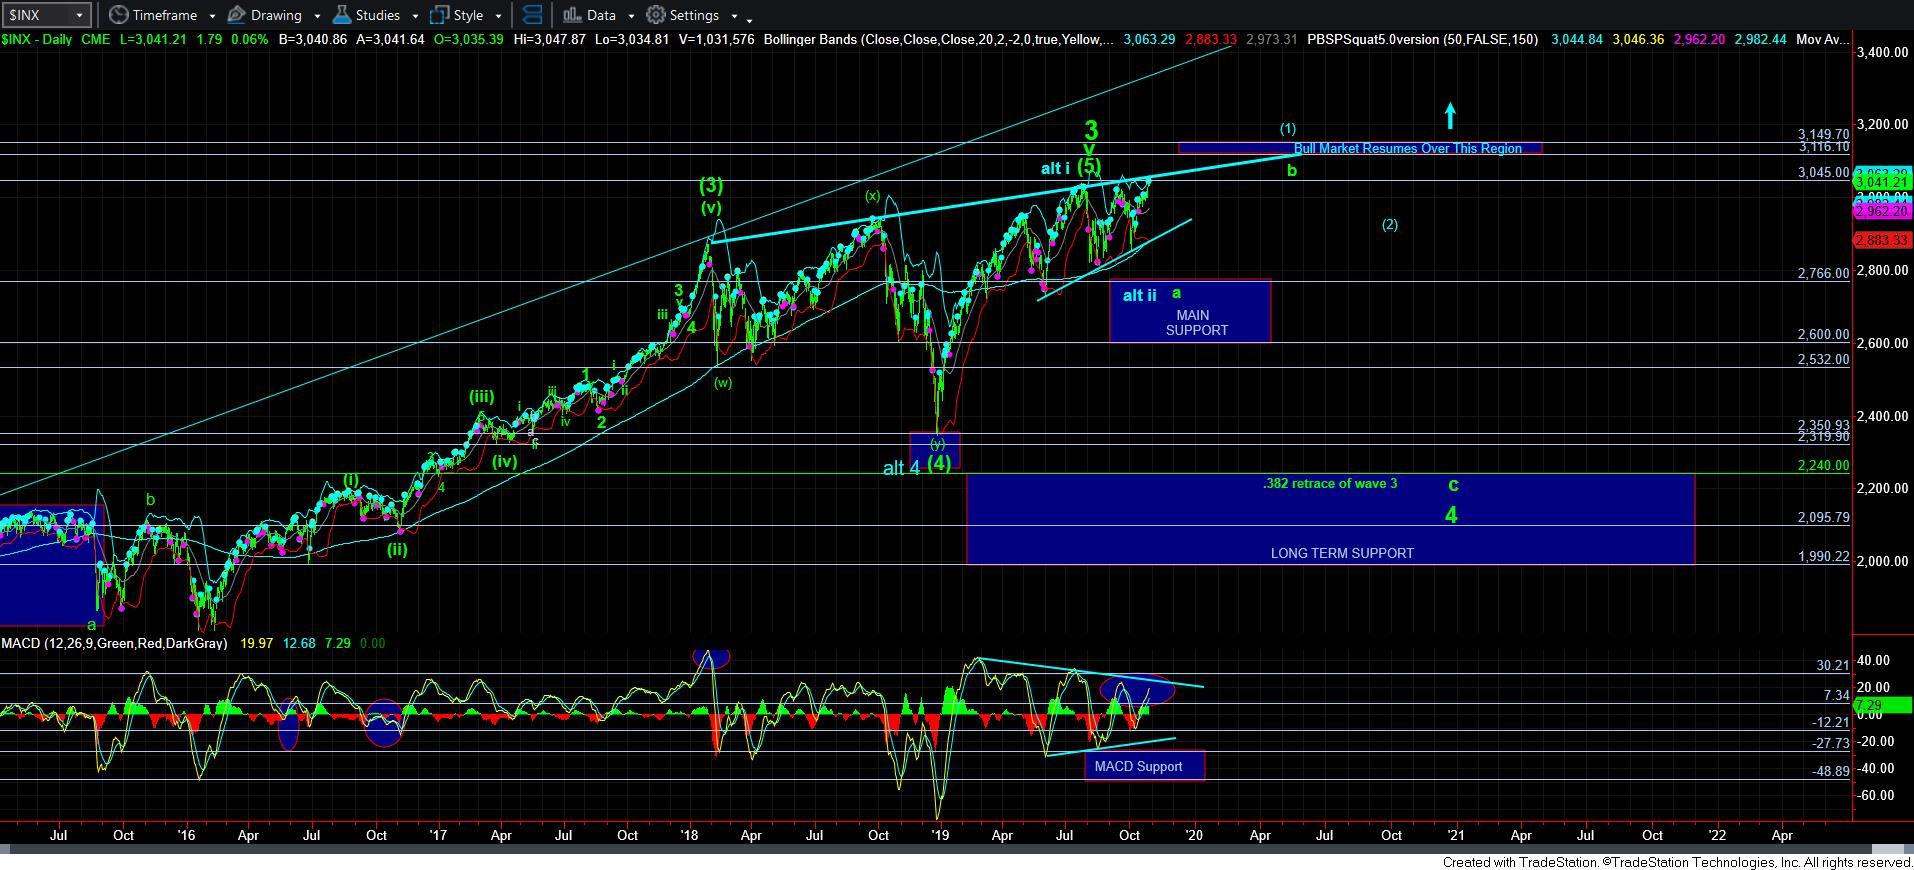
As far as the support levels, this morning, the market held the support noted yesterday at 3030, and then rallied to the next higher target we had on our chart in the 3045SPX region. And, we are still bumping our head upon long term resistance in many charts we track. Therefore, I still retain the same conclusion that we are “topping.” But, we still have no indications yet that a top has been struck.
At this point in time, I will need to see the market break down below the 3030SPX support we held this morning, which should begin the process of turning this chart to the downside. While I still clearly need to see a break down below the 2970/90 support to reduce the potential of another 4-5 to complete this c-wave of [b], the break of 3030 will suggest a test of that support is our next step in this topping process.
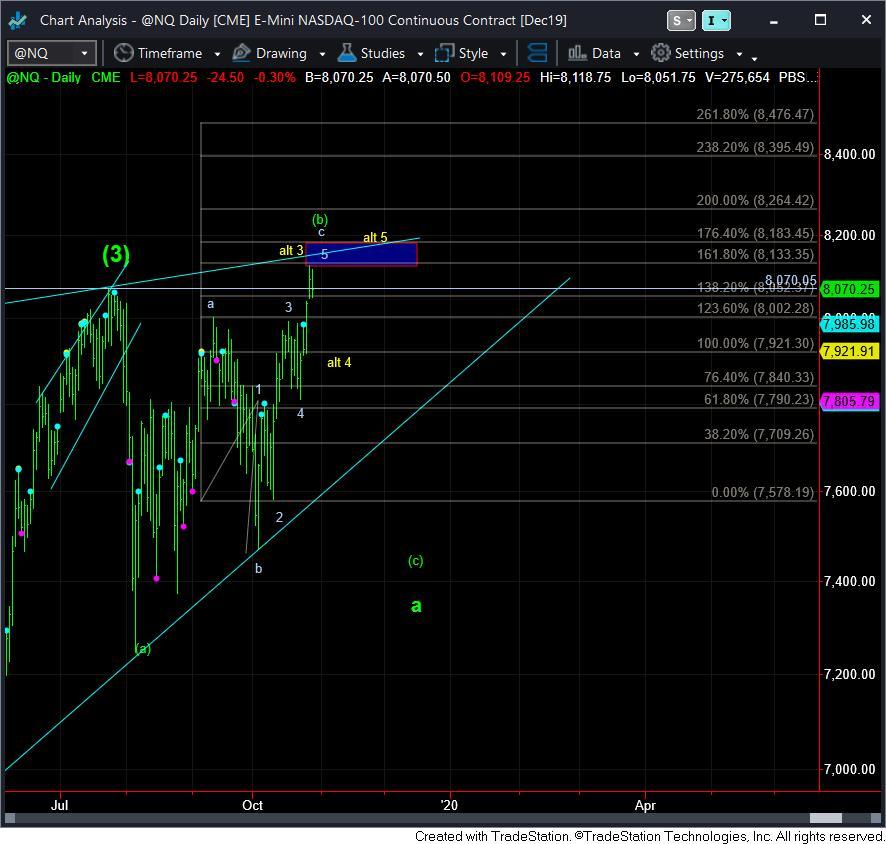
Along the lines of another 4-5 potential before this [b] tops out, I have added an alternative in the NQ outlining that potential, which you can see on the attached chart. But, that does not change my overall larger degree expectations.
For now, I am still of the opinion we are topping out in a very complex and extended b-wave consolidation, which is best and most clearly seen in the 60-minute IWM chart. And, I think it is only a matter of time now before we begin that drop in the [c] wave.