Market Moves Up Sharply Off Support Confirming A Local Bottom
 By
By
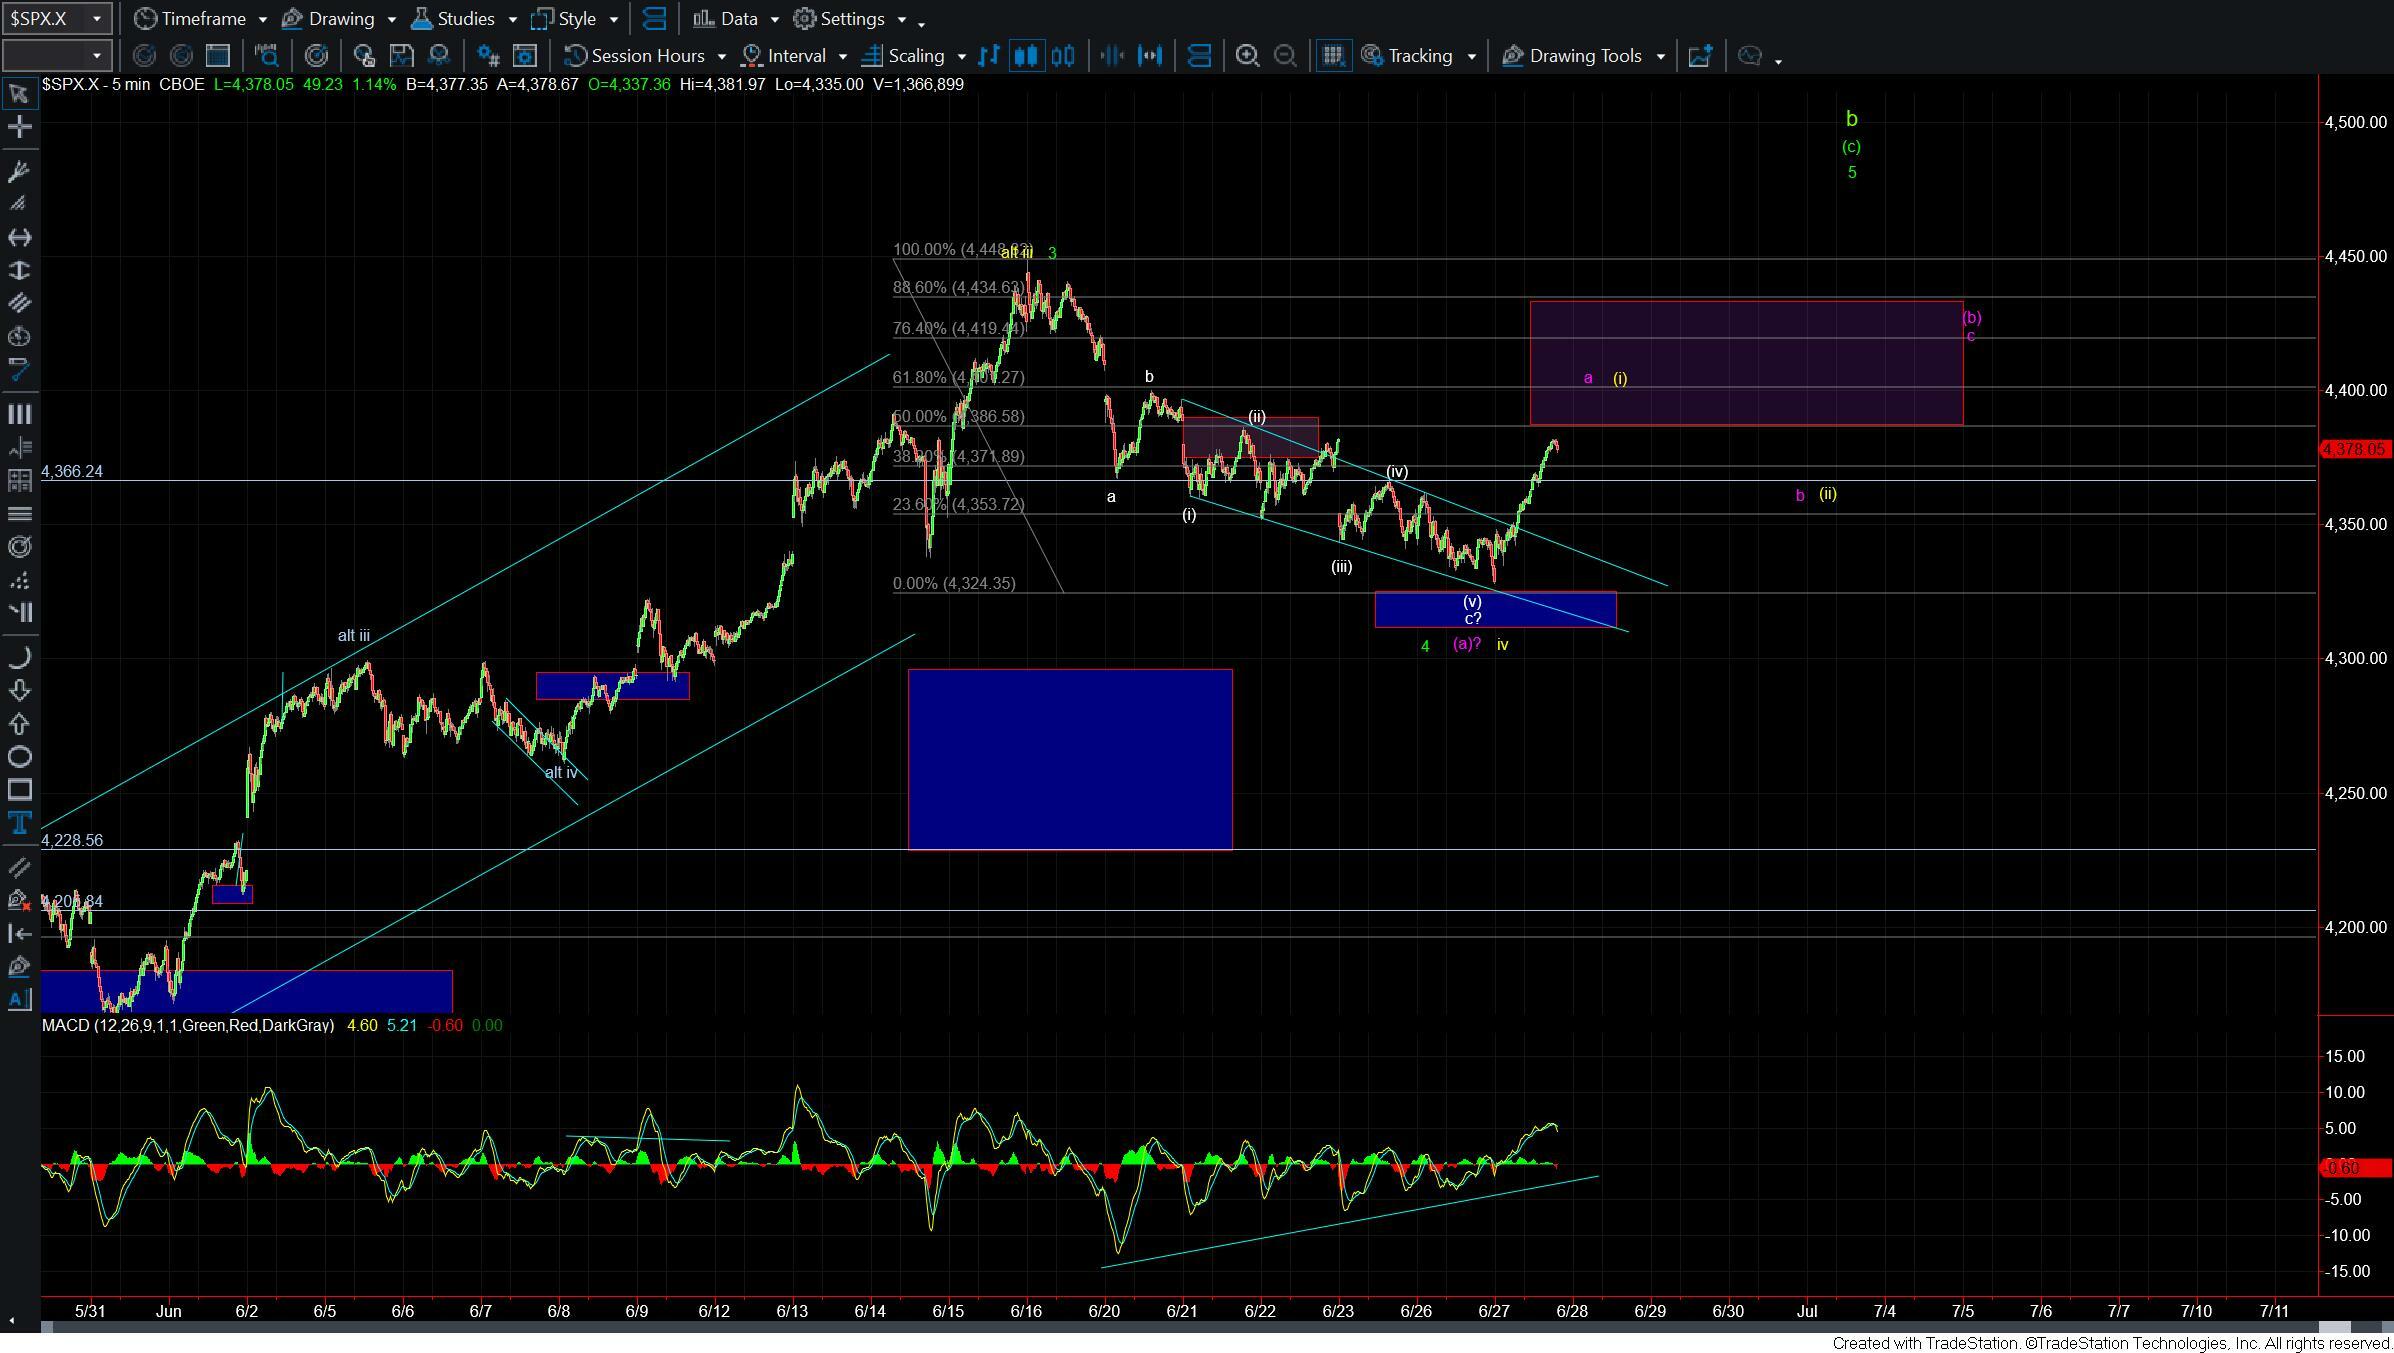
After grinding painfully lower over the past several trading sessions, the market saw a sharp reversal today consistent with the reversal out of the ending diagonal count that we have been watching over the past several days. The overlapping sloppy pattern off of the 4400 high had all of the telltale characteristics of an Ending Diagonal to finish off the wave c off of that 4400 level. Today we got clear confirmation that this was indeed the operative count, as the sharp and quick reversal is also the typical reaction that we see when an Ending Diagonal finally completes.
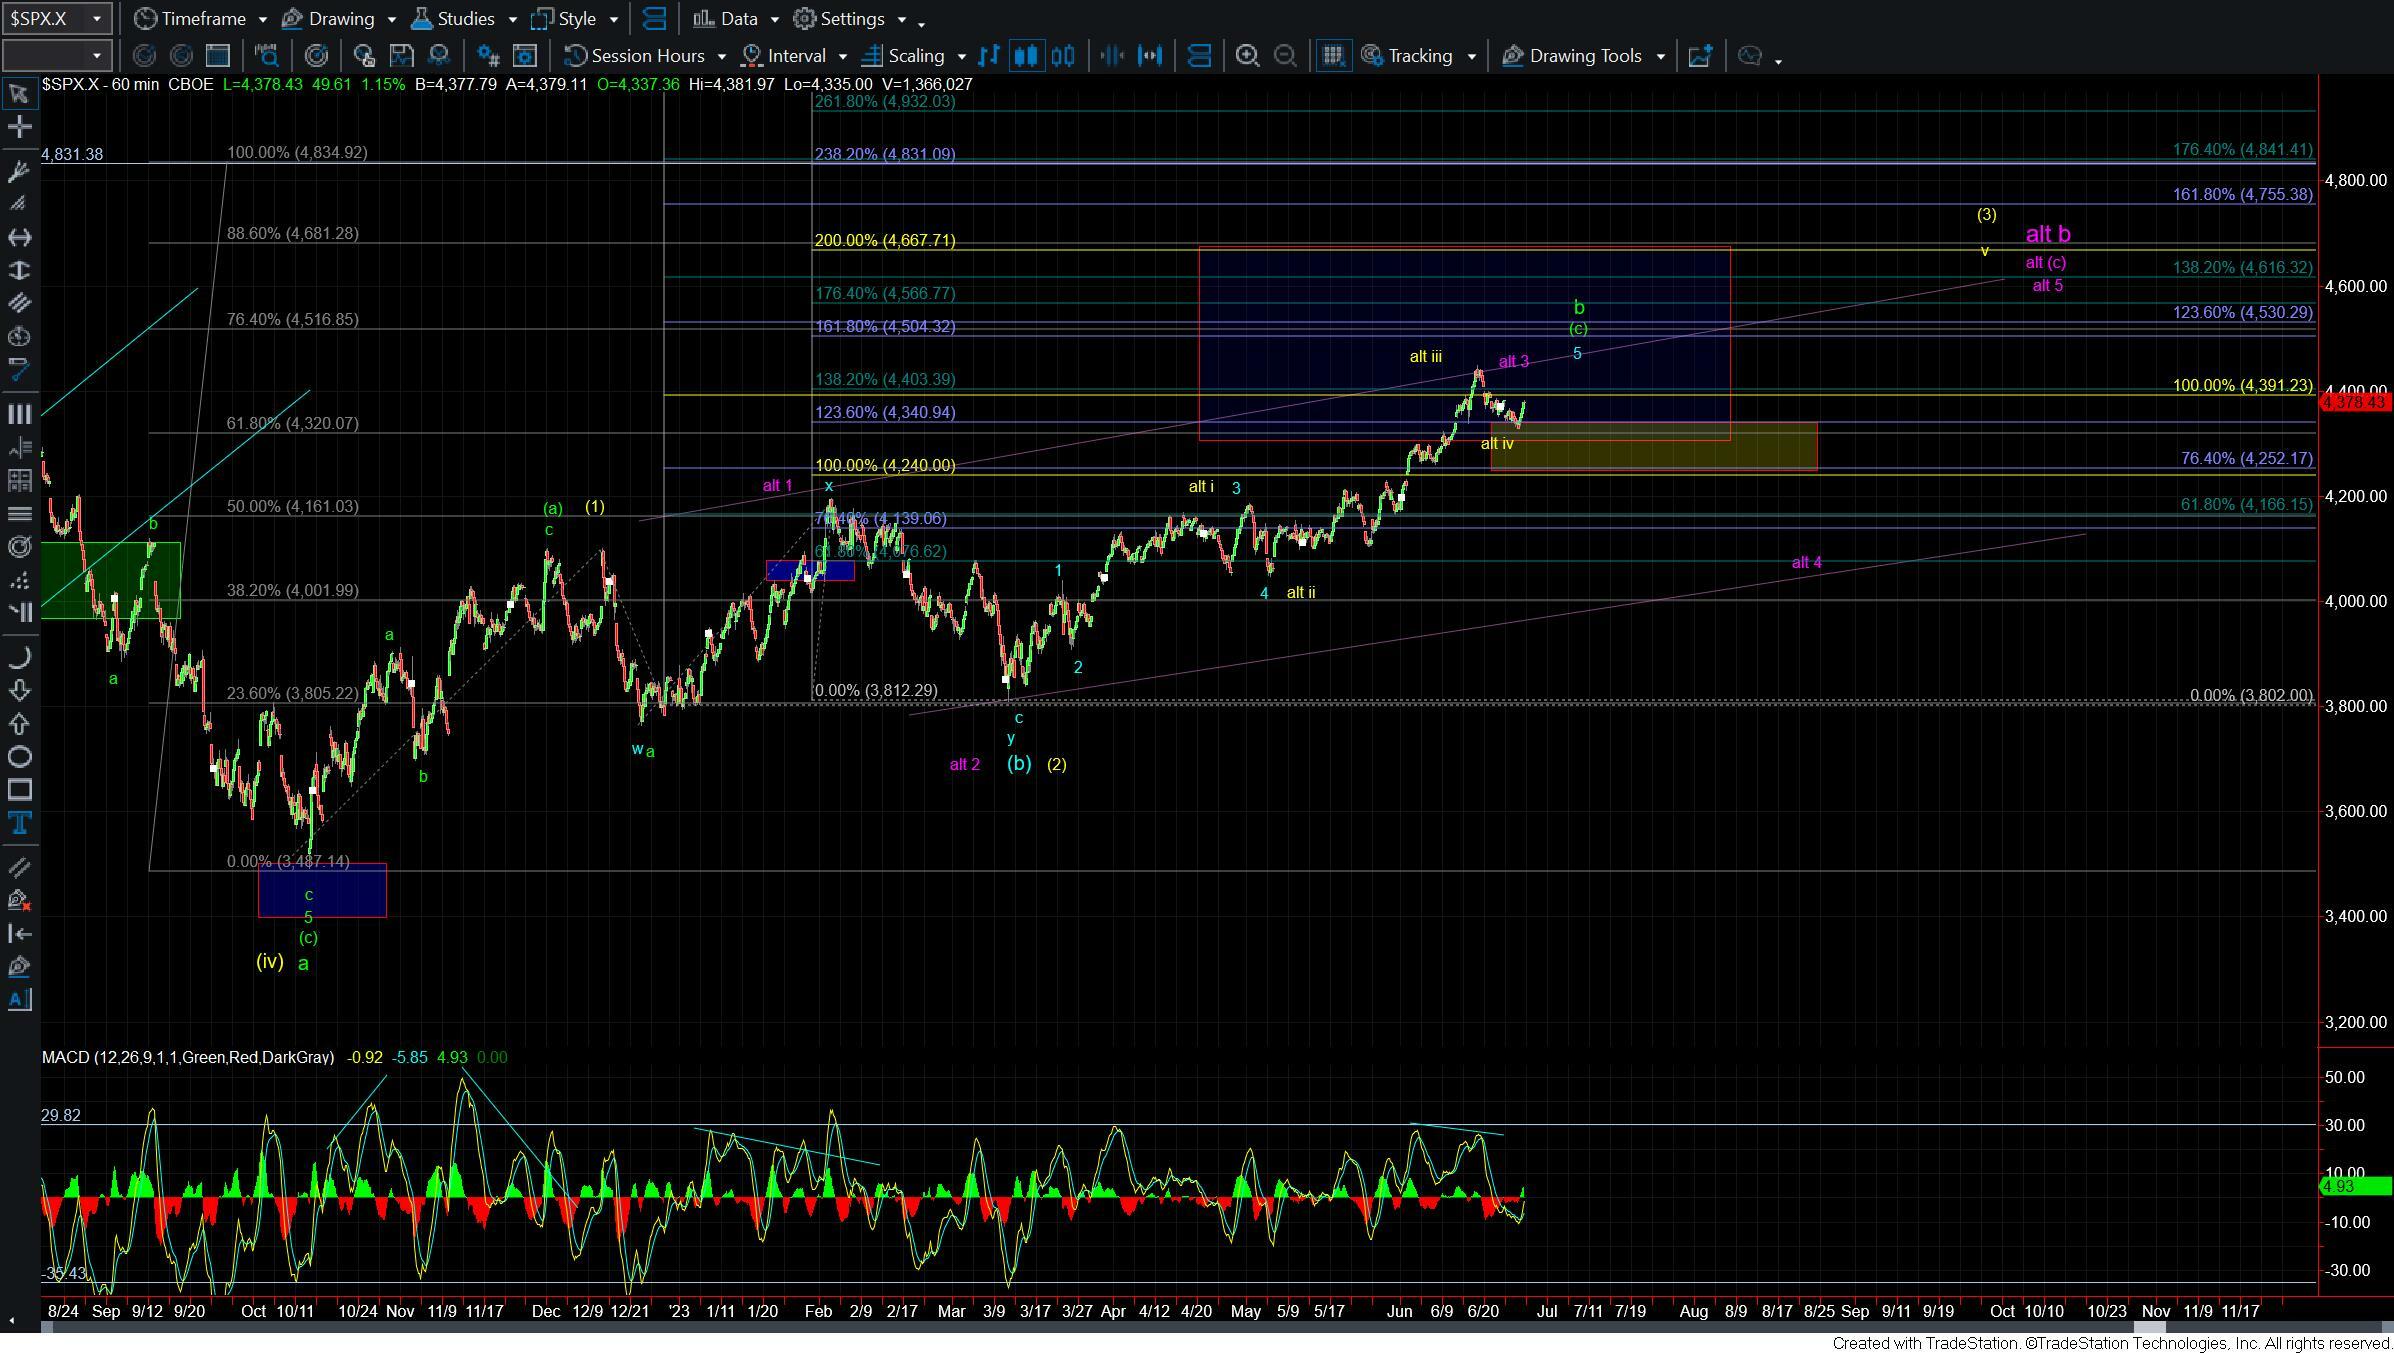
With this move back higher off of support, it is now much more likely that we have completed an ABC corrective pattern into the lows, which is more supportive of the yellow or purple counts as outlined on the larger degree 60min chart. The structure of the next pullback will be helpful in giving us a better idea as to which of these paths we are indeed following, but, in either case, I do think we have some unfinished business to the upside before any further downside action is seen.
GREEN COUNT
Because today's sharp move higher has given us what counts best as a three-wave move down off of the highs, it has become less probable that we have already topped in the green wave b. Because we are looking for a wave c down under that count, we really needed to start with a five-wave move to the downside. So, if we are going to see a top under that green count, it is more like that we will need another push higher into the larger degree overhead resistance zone and back over the 4450 high before we can call a confident top in that green wave b.
With all of that being said, If we were to see a sharp drop back under today's low that also continues to follow through as an impulse, we can't fully rule out that we have already seen a top in that wave b; however, it would require a more complex start to the c wave down, so for the time being I think it is less probable that we have already topped in the green wave b.
YELLOW COUNT
The corrective move lower followed by the sharp reversal higher has certainly opened the door up to the yellow court seeing follow-through to the upside. We do, however, still need to see confirmation of this by seeing a wave (i) top and then a corrective pullbackw in a wave (ii). That should then be followed up with a break back over the 4434 high and ultimately over the 4450 level to start the wave v of larger wave (3) up off over the October lows.
PURPLE COUNT
Finally, the purple count is still in play here, and under this count we would need to hold under the 4387-4434 zone and see a five-wave move to the downside that ultimately breaks back under today's LOD. This is the more sloppy of the paths that I am watching and would likely take the SPX grinding lower before finding a larger degree bottom in the 4200-4100 region. But it is certainly on my radar as I do think it fits fairly well with what I am watching on the Nasdaq charts.
I also want to note that the 60min MACD curled back up today after finding support in oversold territory. This is supportive of the market still needing higher levels before moving back under today's LOD. The big question I have at the moment is whether those higher levels will take us back over the 4450 high or if the market will turn back down from the resistance zone just overhead. The structure of the next move pullback should help give us a better idea as to which of these paths we are indeed going to follow. The parameters are fairly clear as laid out above, so from here is should be a matter of watching to see what type of structure and price action we see over the course of the next several trading sessions.