Market Moves Lower and Breaks Upper Support
 By
By
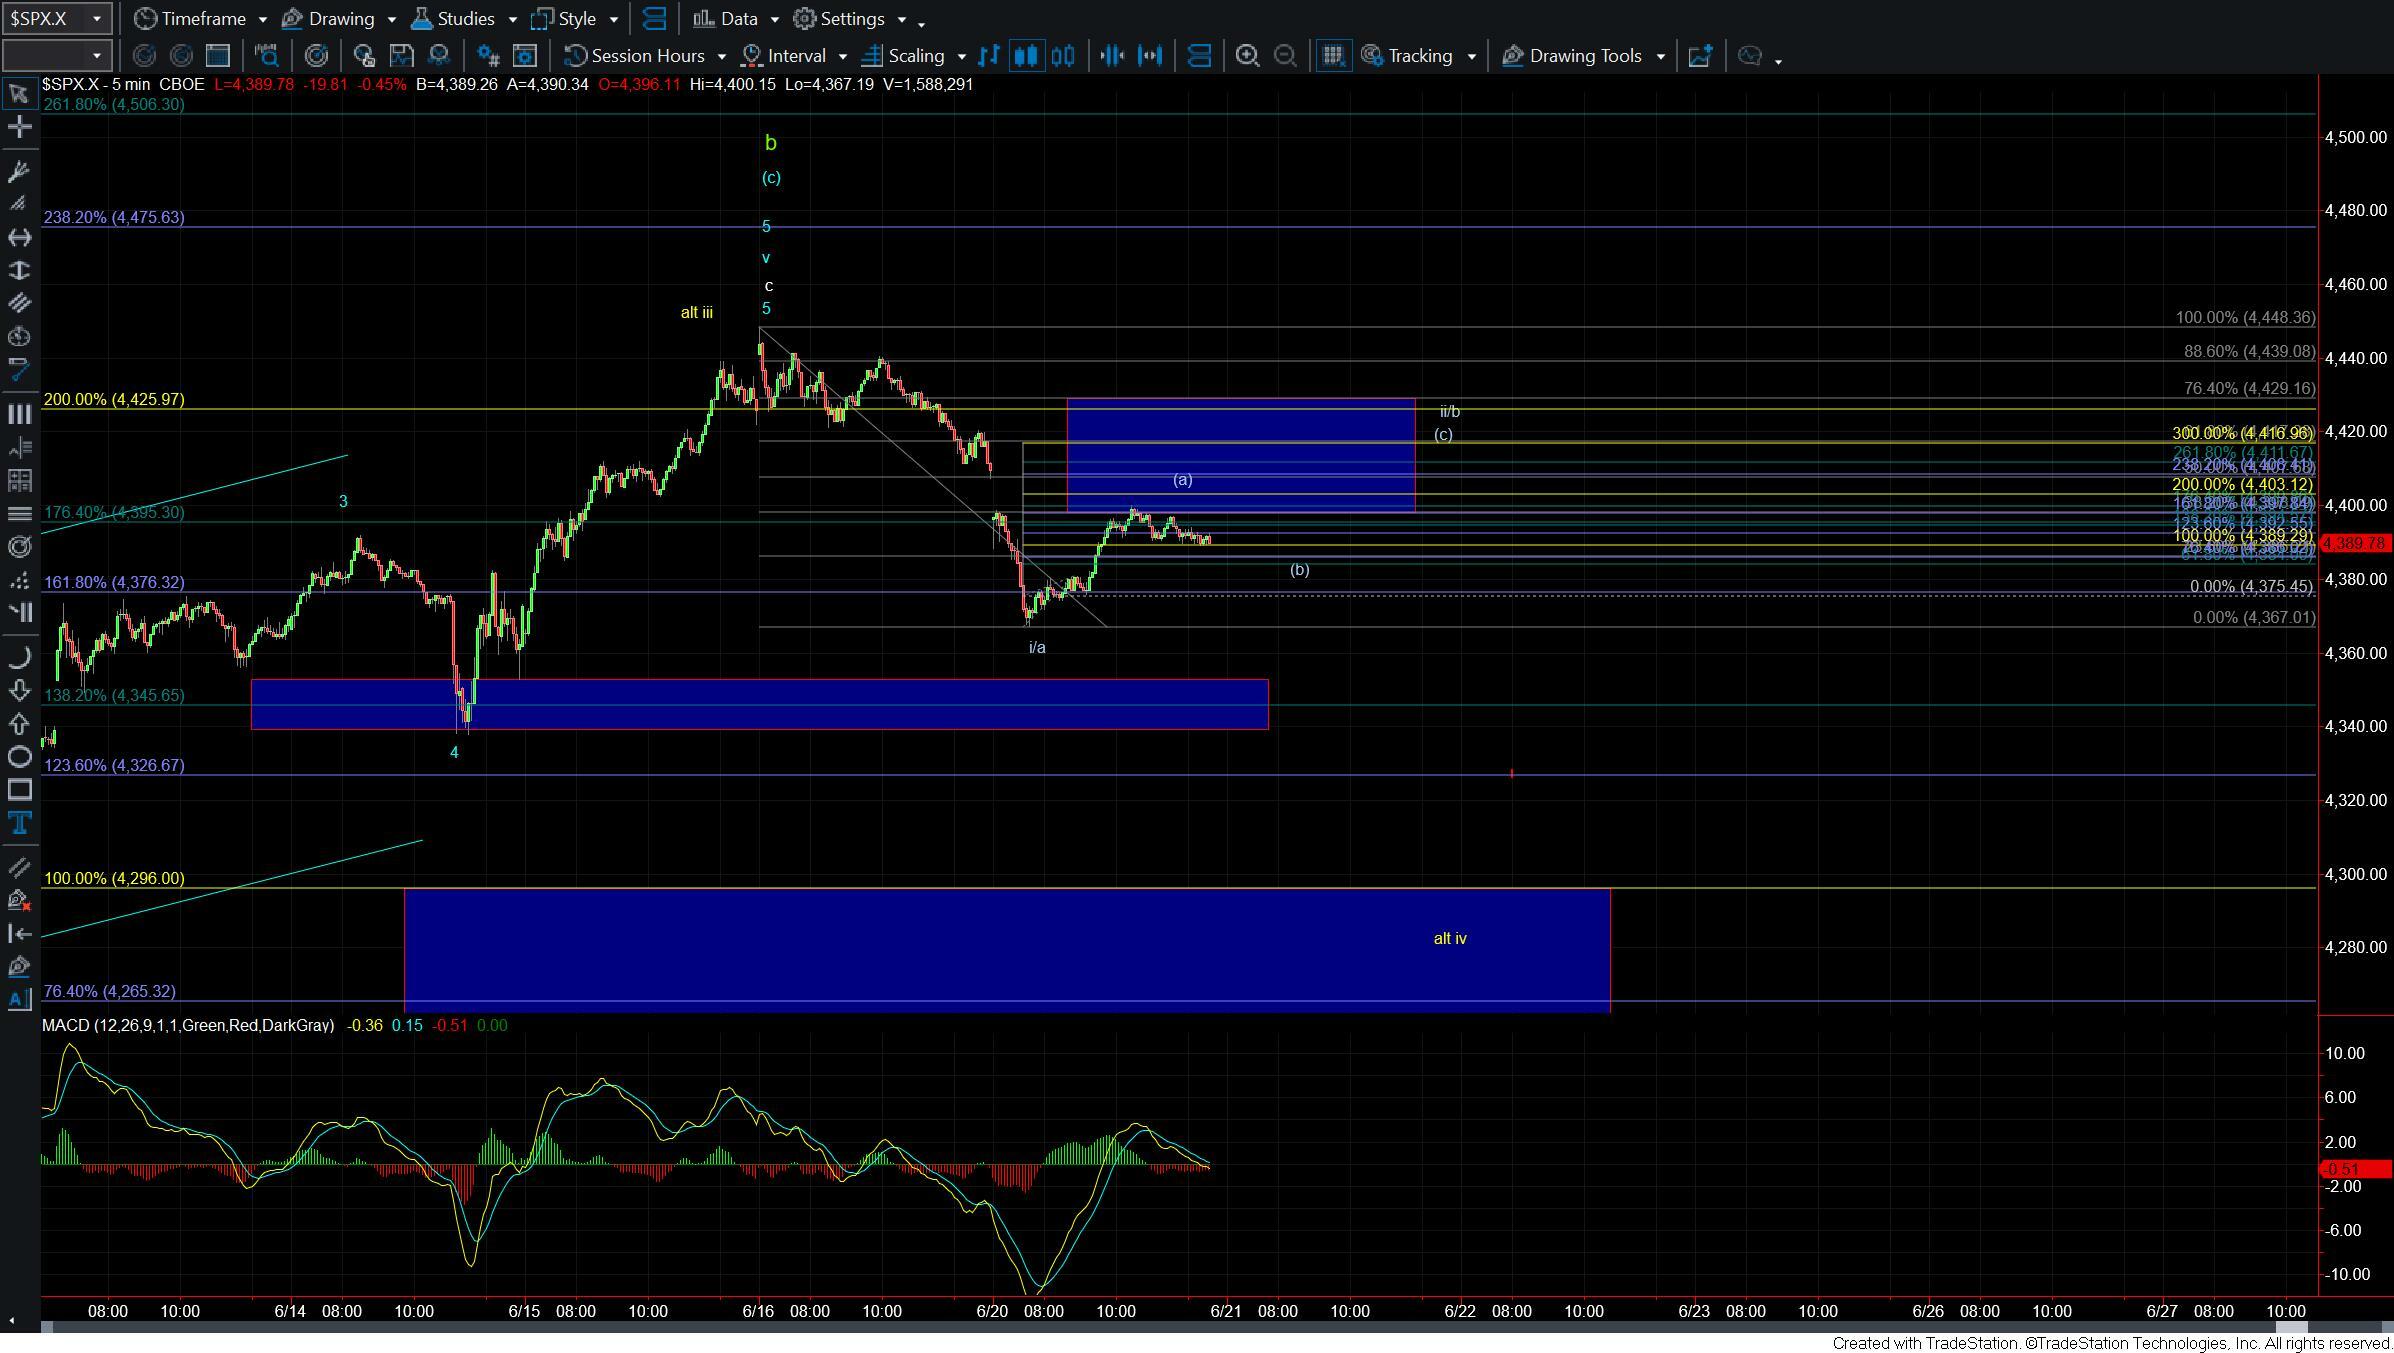
Today we saw the market open lower and continue to move lower in the morning session breaking through the lower end of the upper support region thus giving us an initial signal that we have put in at least a local top. We have since moved higher during the afternoon trading however are well under micro resistance which is still suggestive that we have put in at least a local top. From here it is going to be a matter of how the structure to the downside develops which will give us a better idea as to whether we have topped in all of the wave b or are simply dealing with a corrective move to the downside.
The break of micro support has given us a signal that we have likely put in a local top. Furthermore, I can make the case that we have five down on the ES chart. So with that, my base case is that today's low was the bottom of a wave a/i. That would make the push-up off of the lows part of a wave ii or b. Overhead resistance for that wave ii/b on the micro level comes in at the 4390-4429 zone. As long as that zone holds then my base case will remain that we should see a lower resolution to the downside in at least a wave c. How we follow through from there will be quite important as to whether we have stuck a top in all of the wave b or if we are simply going to see a corrective move to the downside that will ultimately take us back over last week's highs.
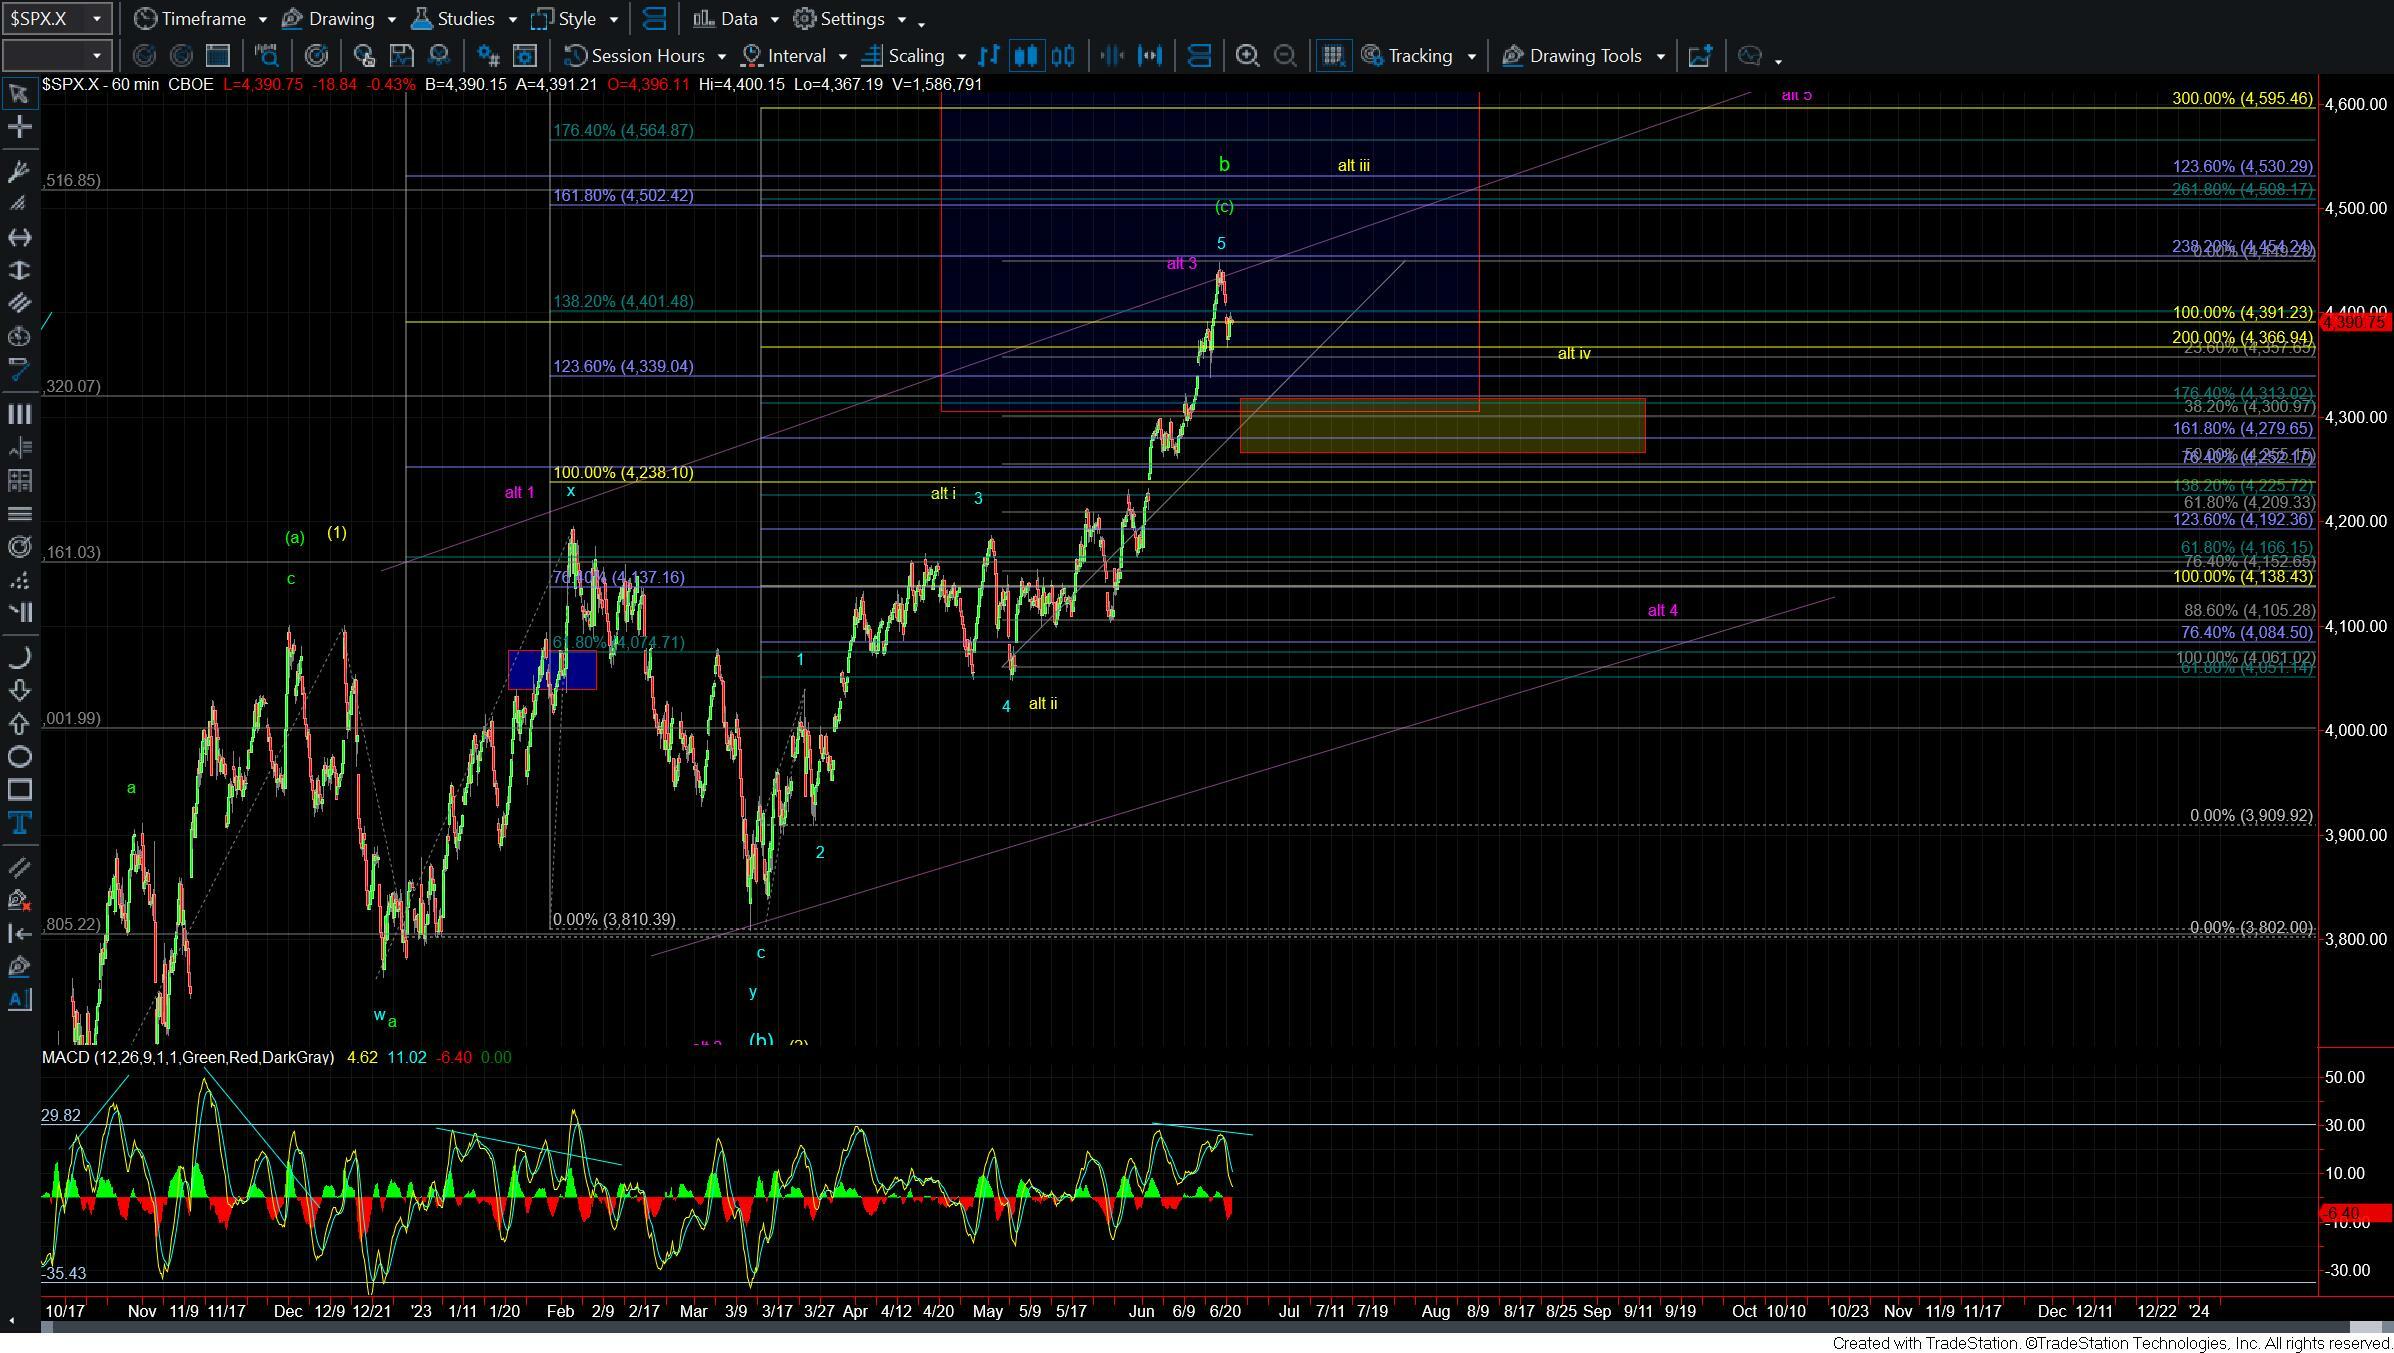
If we see a full five down off of the highs of one larger degree it would give us an early signal that we have put in a top in the green wave b. That should then be followed up with a break under the 4313-4252 zone to give us further confirmation that we have indeed topped in all of the green wave b. If we only see a corrective three-wave move to the downside that holds that 4313-4252 region and then we turn up from there impulsively it would give us an early signal that we may be bottoming in the yellow wave iv as part of the larger yellow count that should ultimately take us to new all time highs.
If however, we manage to break under that support zone but do so correctly then it would open the door to the purple count which I am also watching as an alternate. I think this may become a more important count should we see a drop under the support zone note above but with a corrective start to that move rather than an impulsive one. This purple count actually fits quite well with the potential count I am watching on the NDX and I could even see how it would fit with a possible corrective start lower on the RUT. So again while I am viewing this purple count as an alternate at this point in time should we break below support and do so in a corrective manner I would be keeping a much closer eye on this purple count.
Today's price action has given us an early signal that a top is indeed in place however the structure and price levels over the next couple of weeks should help tel the story of where this market is heading over the course of the next several months. So this region will continue to be an important inflection point and one that we will need to keep a close eye on as we move through the pattern in the days and weeks ahead.