Market Moves Lower "Despite" Moving Higher Yesterday
 By
By
After a strong rally yesterday and a lot of excitement after the close regarding the NVDA earnings announcement and subsequent after-hours price pop, the market is trading down significantly. This move lower is despite the fact that there was such good "news" yesterday and no real "bad" news today. So little happened today that the pundits failed to come up with any plausible reason to plug into their headline as to the "reason" for this drop. When there is no news that can plausibly explain the direction of a market move then the pundits are forced to go with the tried and true "despite" in their headline. Today on CNBC the headline was "Dow falls more than 200 points, Nasdaq slides despite Nvidia earnings beat". While the headline of this article is just as nonsensical as the one the professional pundits put out today, at least I can say it is more factual.
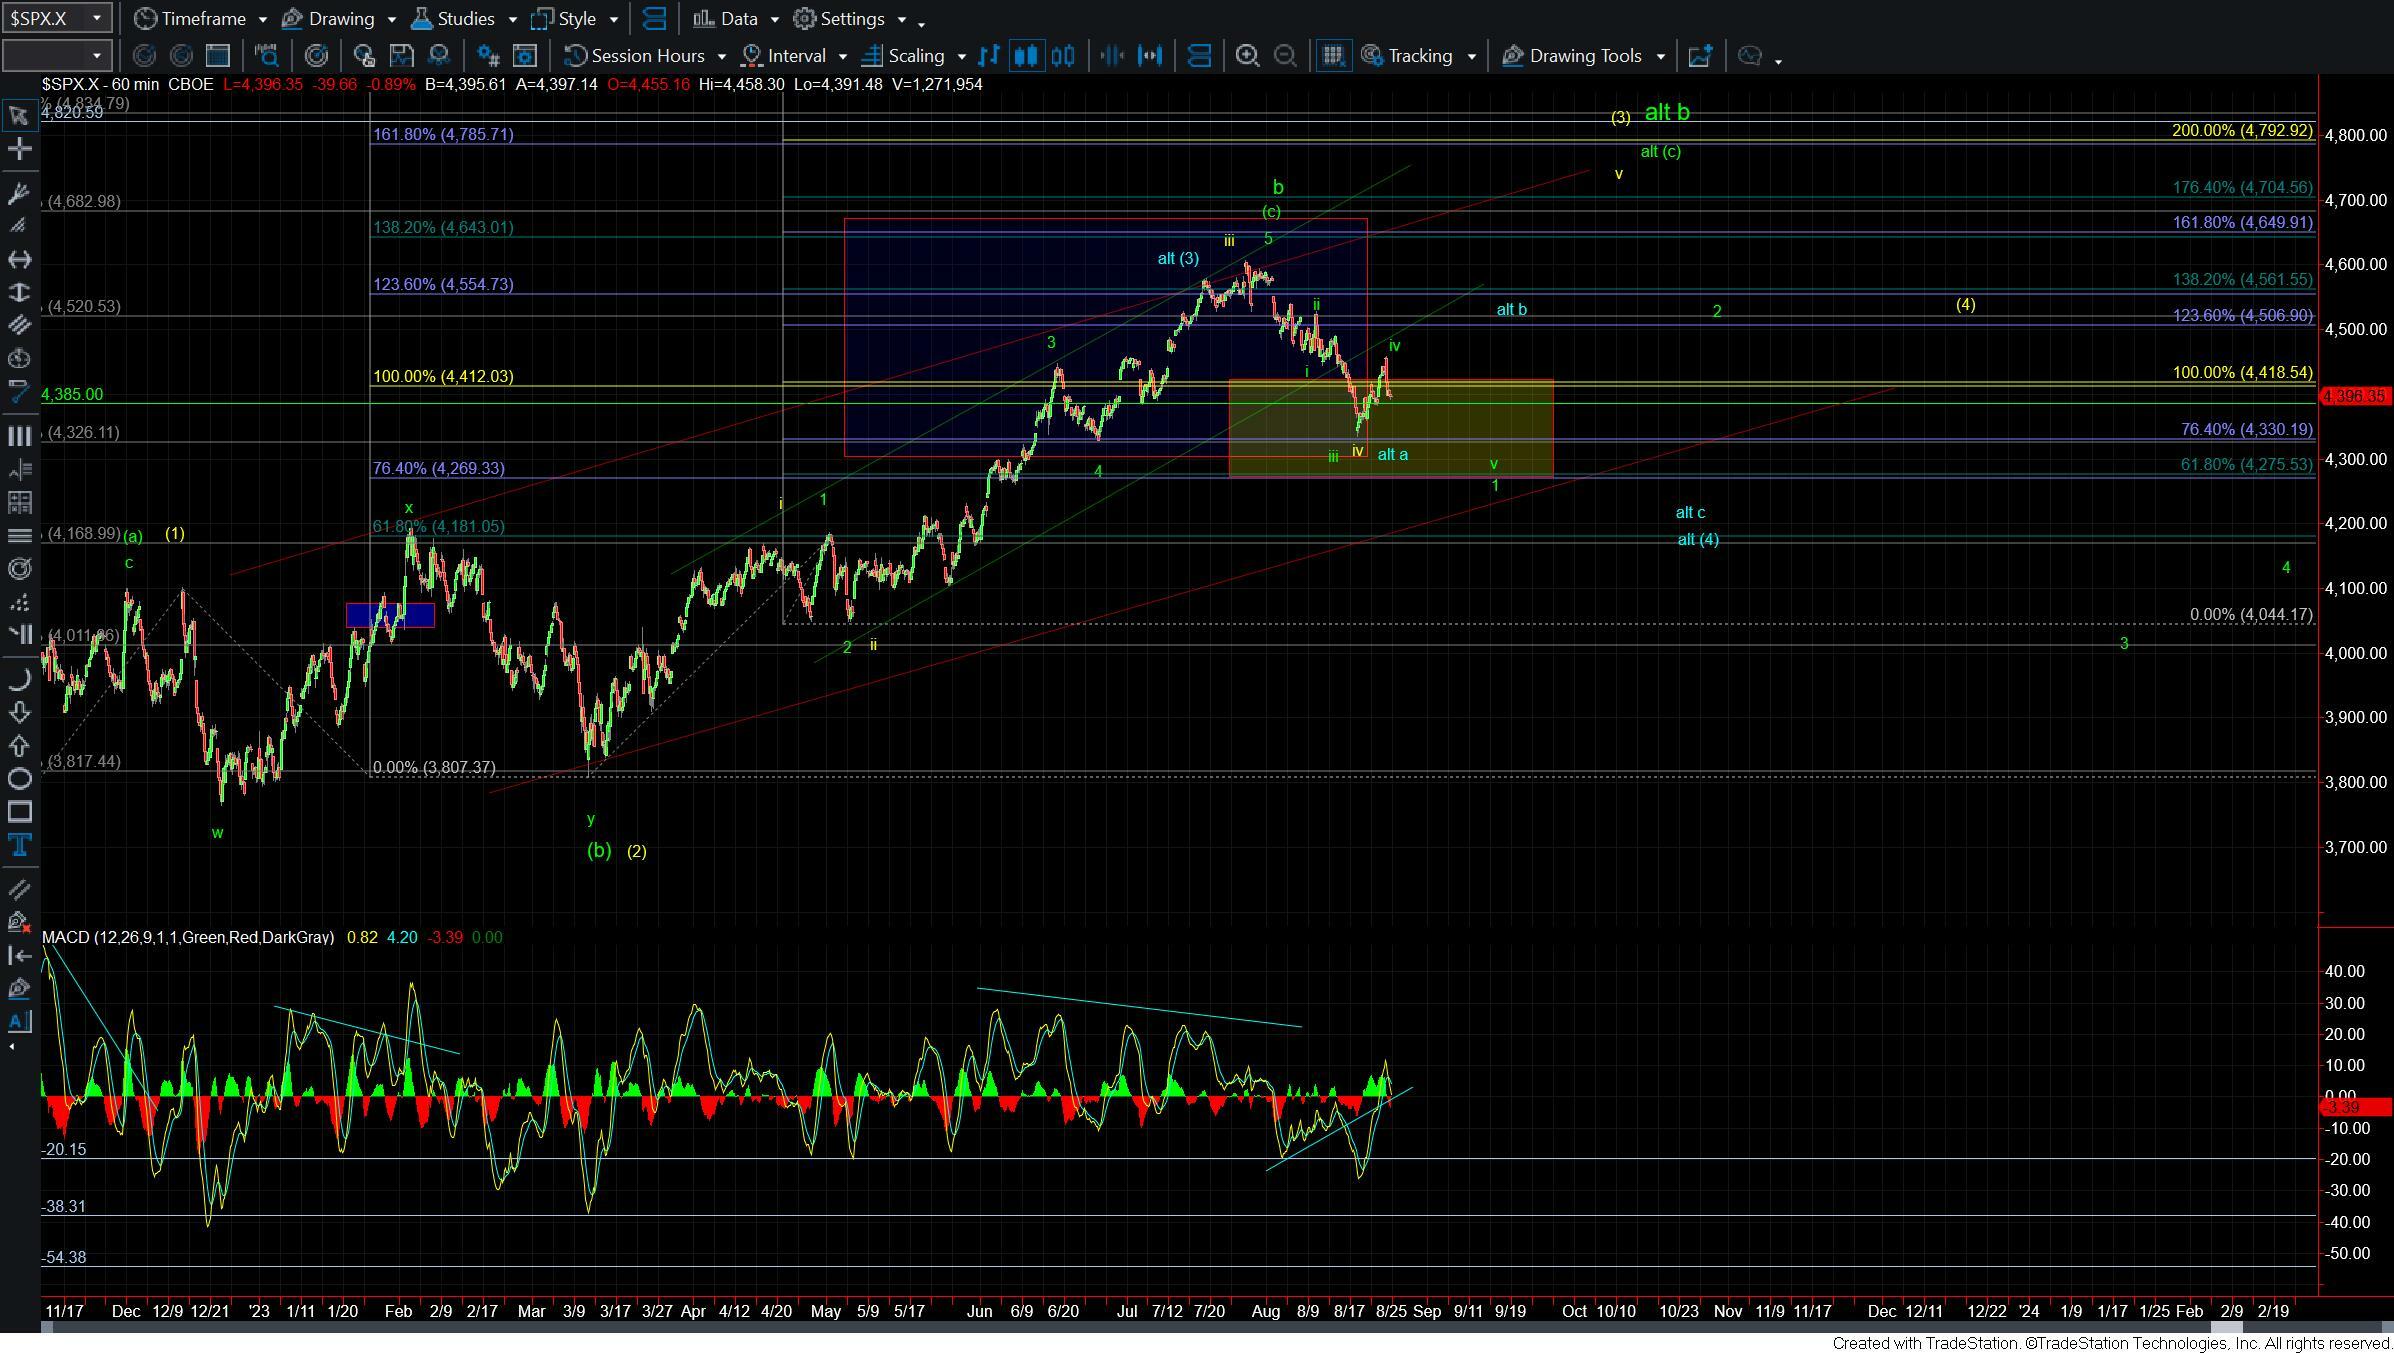
Moving into the charts, as we have been noting over the past several days the move up off of the lows and over resistance has left us with quite a sloppy series of potential counts. The deep retrace today has however at least given us a clear local top at today's high of the day and clear support levels to watch to signal if we are indeed going to see a direct push to new lows or if we have stuck a more significant bottom at the 4333 low.
Yellow Count
For the yellow count to give us confirmation that it is following through I would want to see this breakout over the 4458 high and then move up towards the 4552-4600 region for the wave (iii). This should then be followed up with a wave (iv) and (v) that likely needs to extend up into the 4704-4880 region. As Avi noted earlier there are some issues with the fibs and how far this would need to extend to reach those levels which is certainly a cause for concern on this yellow count however if we begin to see a strong rally after a corrective retrace towards the 4552-4600 region it would give us an early signal that we are indeed following this yellow count.
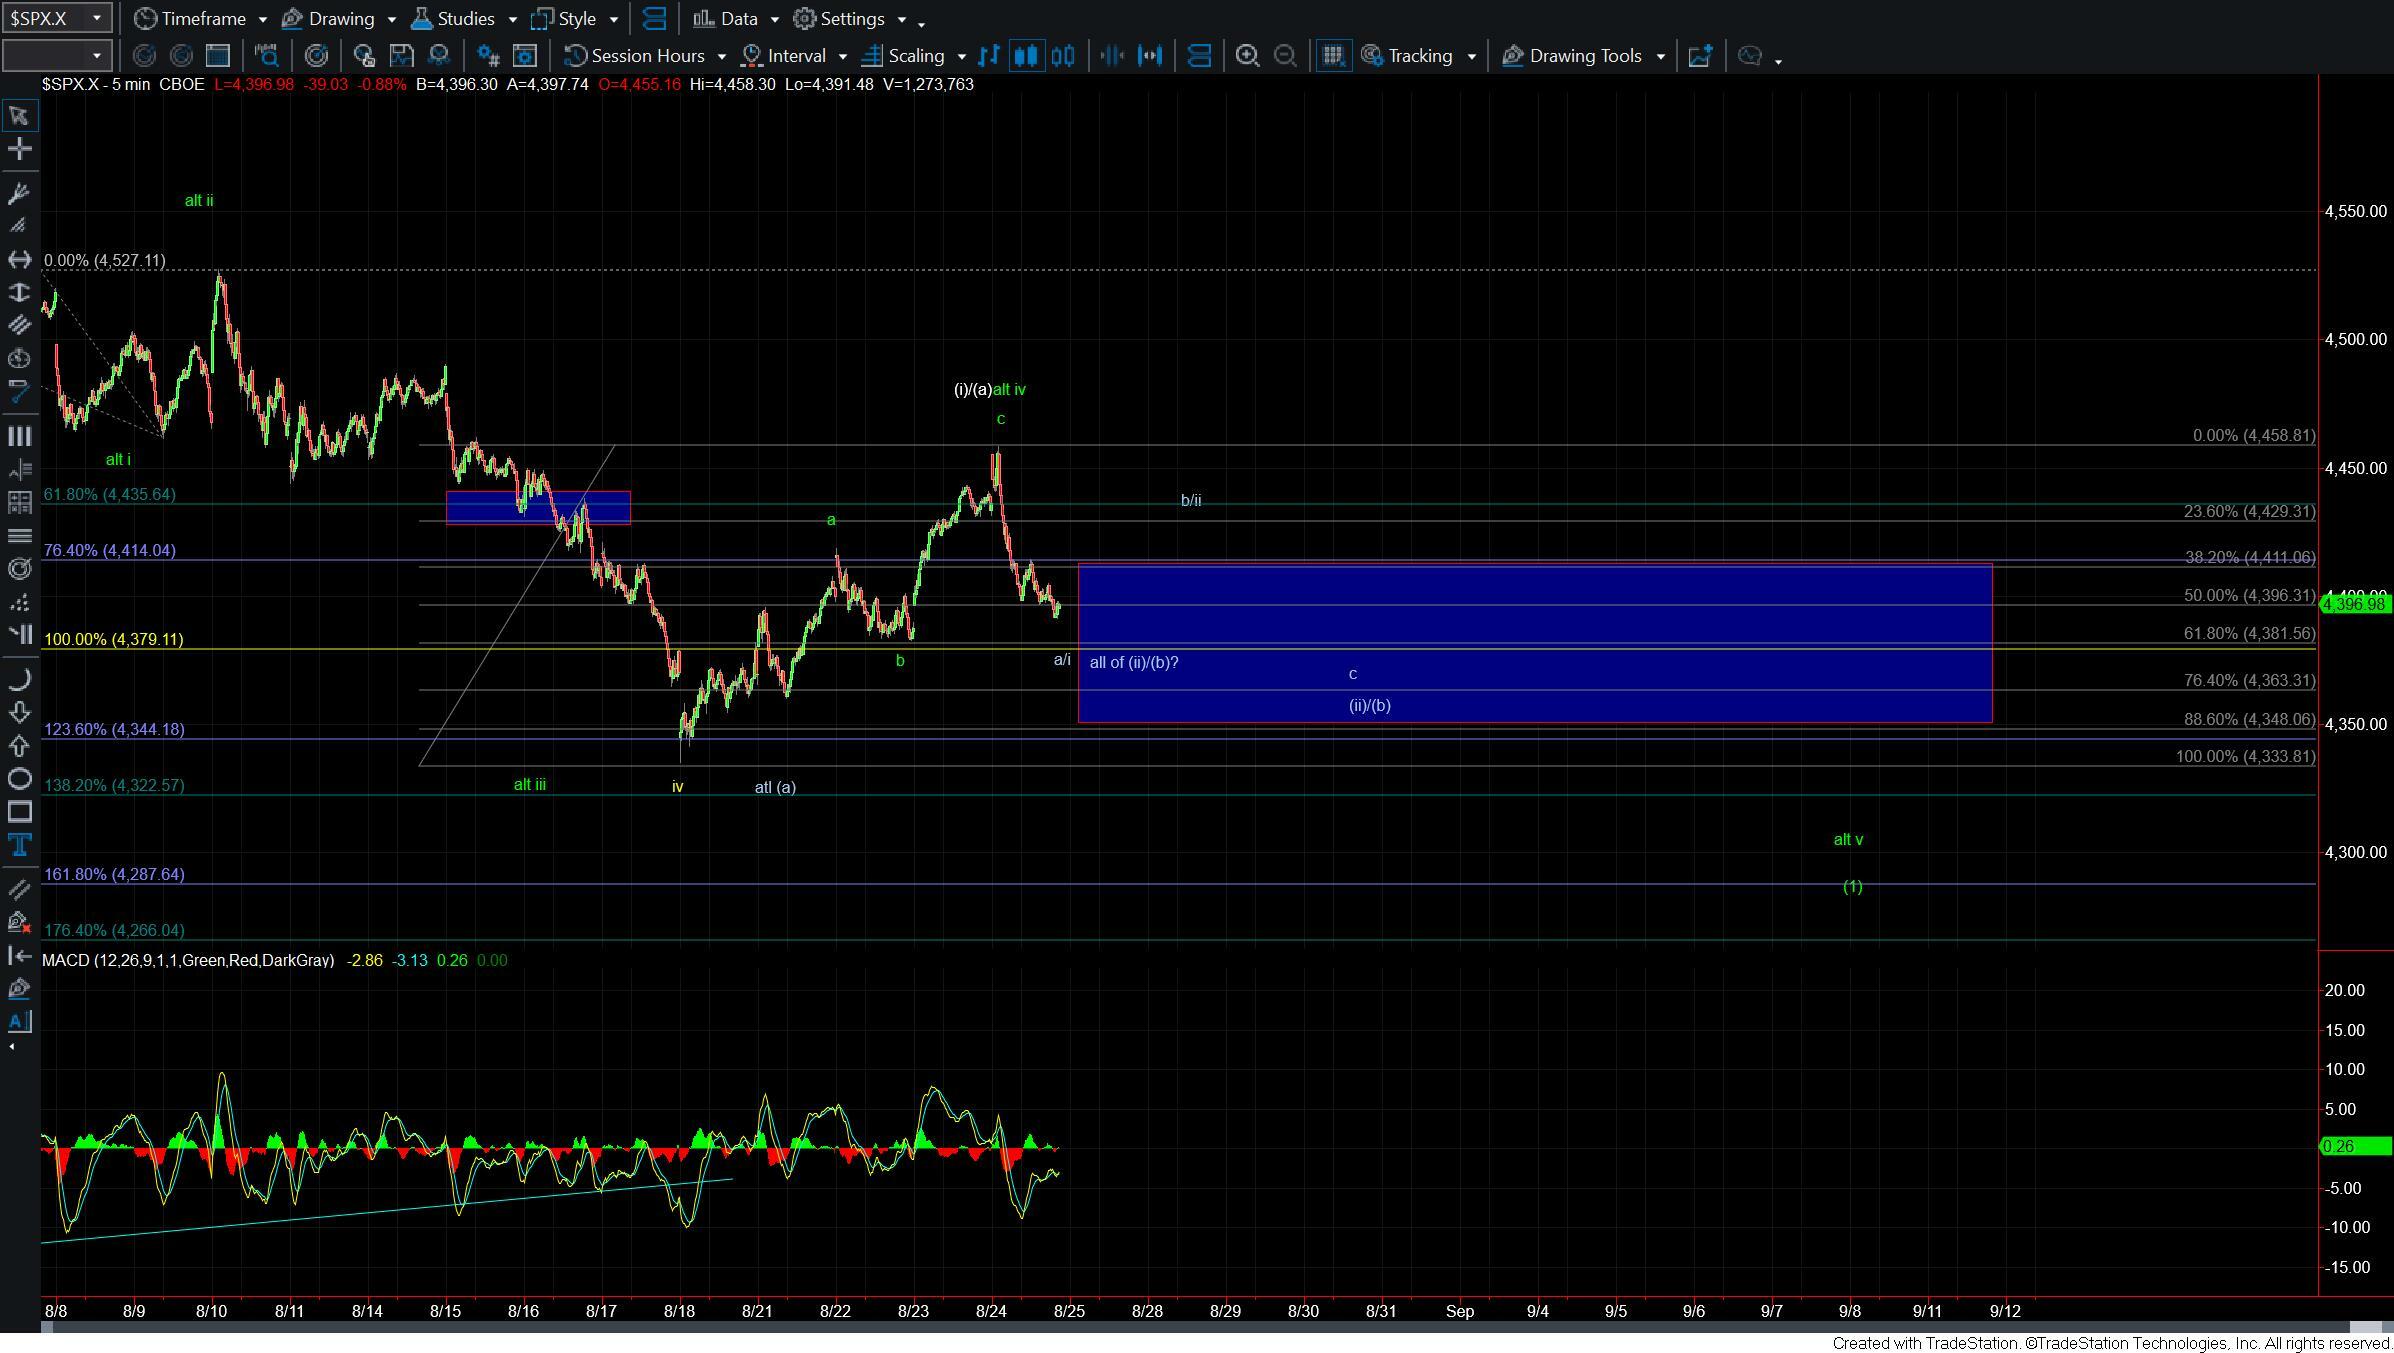
Green Count
The green count would need to see another lower low under the 4334 level while holding under the 4458 high to give us a potential five wave leading diagonal down off of the highs. This should then be followed up with a corrective rerace higher for a wave 2 of a larger wave (1) of c down. If we break back over the 4458 level then if leaves the door open to the yellow count as noted above or the blue count.
Blue Count
The blue count would suggest we are forming a larger ending diagonal up off of the October of 2022 low. Under that count, we would see a wave b higher over the 4458 level followed by a break back under the 4434 low for a larger wave c of (4) before moving back up over the ATH's for a final wave (5) in ending diagonal form. If we do move higher we can lay out the overhead resistance levels to watch under this case but for the time being, it will remain an alternate path that remains on our radar in the event that we fail to see a strong and sustained break higher.
While the pattern at the moment is far from ideal and we still have several paths that we have to look towards. We do have fairly clear parameters to watch to help give us guidance. I will note that the patterns that I am watching on both the Nasdaq and Russell 2000 are at the moment not nearly as complex as that of the SPX. We should have some resolution on this chart in the next couple of weeks at which point the direction should be set at least into the next year. In the meantime, we have to continue to stay on our toes and remain nimble as we navigate this challenging market environment.