Market Meanders But Overall Pattern Remains Unchanged
 By
By
Today the market opens lower once again however managed to hold support and push higher into the late morning and afternoon session. This price action has done little to resolve the micro wave count and there while the base case remains that we have put in at least a local top we still need to see more wave structure to give us a better idea as to where the larger degree pattern is taking us in the weeks and months ahead.
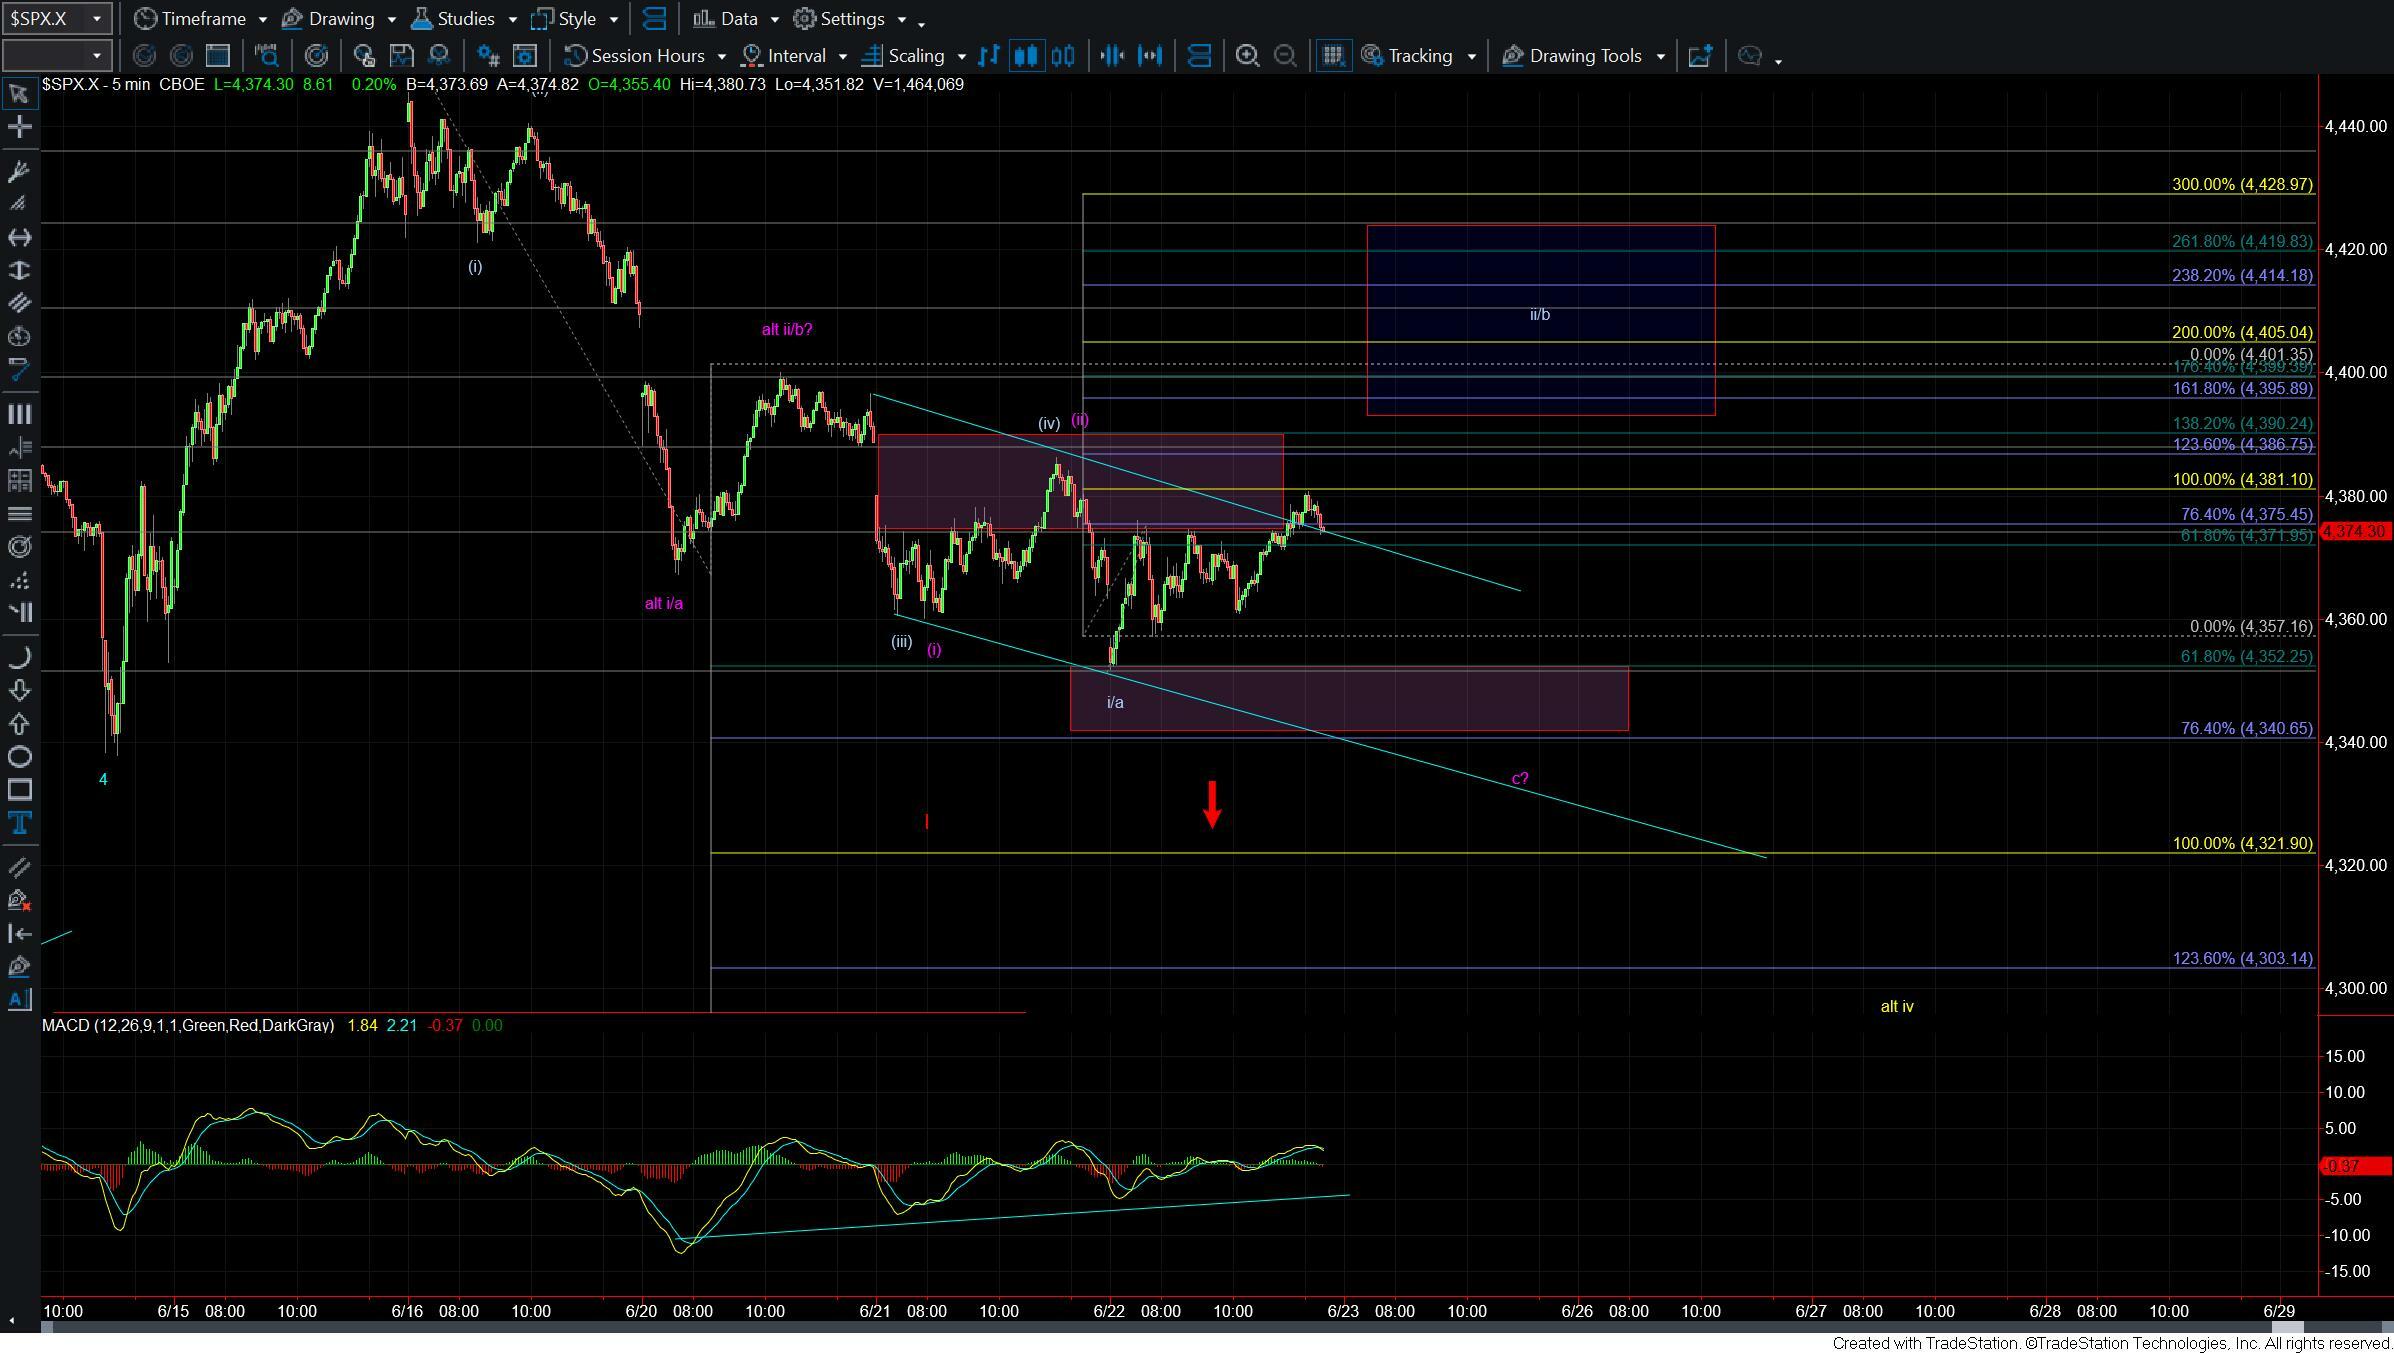
I am still watching the purple and white counts on the five minute chart. The white count is similar to what I laid out yesterday in that I am looking for a wave ii/b retrace up into the 4377-4423 zone under this case. We should have put in a bottom at today's low under this white count with the move up off of that low being part of the wave ii/b. From here we simply need to hold the LOD and continue to push higher into that rerace zone overhead. That should then be followed up with a five wave move back to the downside to begin the wave c/iii down. Once we see where we actually top in that wave ii/b we can then layout the downside targets and parameters for this path.
The purple count is similar to what I was watching yesterday however with his price action today it looks like if we are indeed following this path the c wave of the ABC down may be following an ending diagonal. Under this case we should hold under the 4388 level and make another lower low under the LDO at the 4352 level. From there I would be looking for a retrace back up into the wave ii/b retracement zone before heading lower once again for a wave c down.
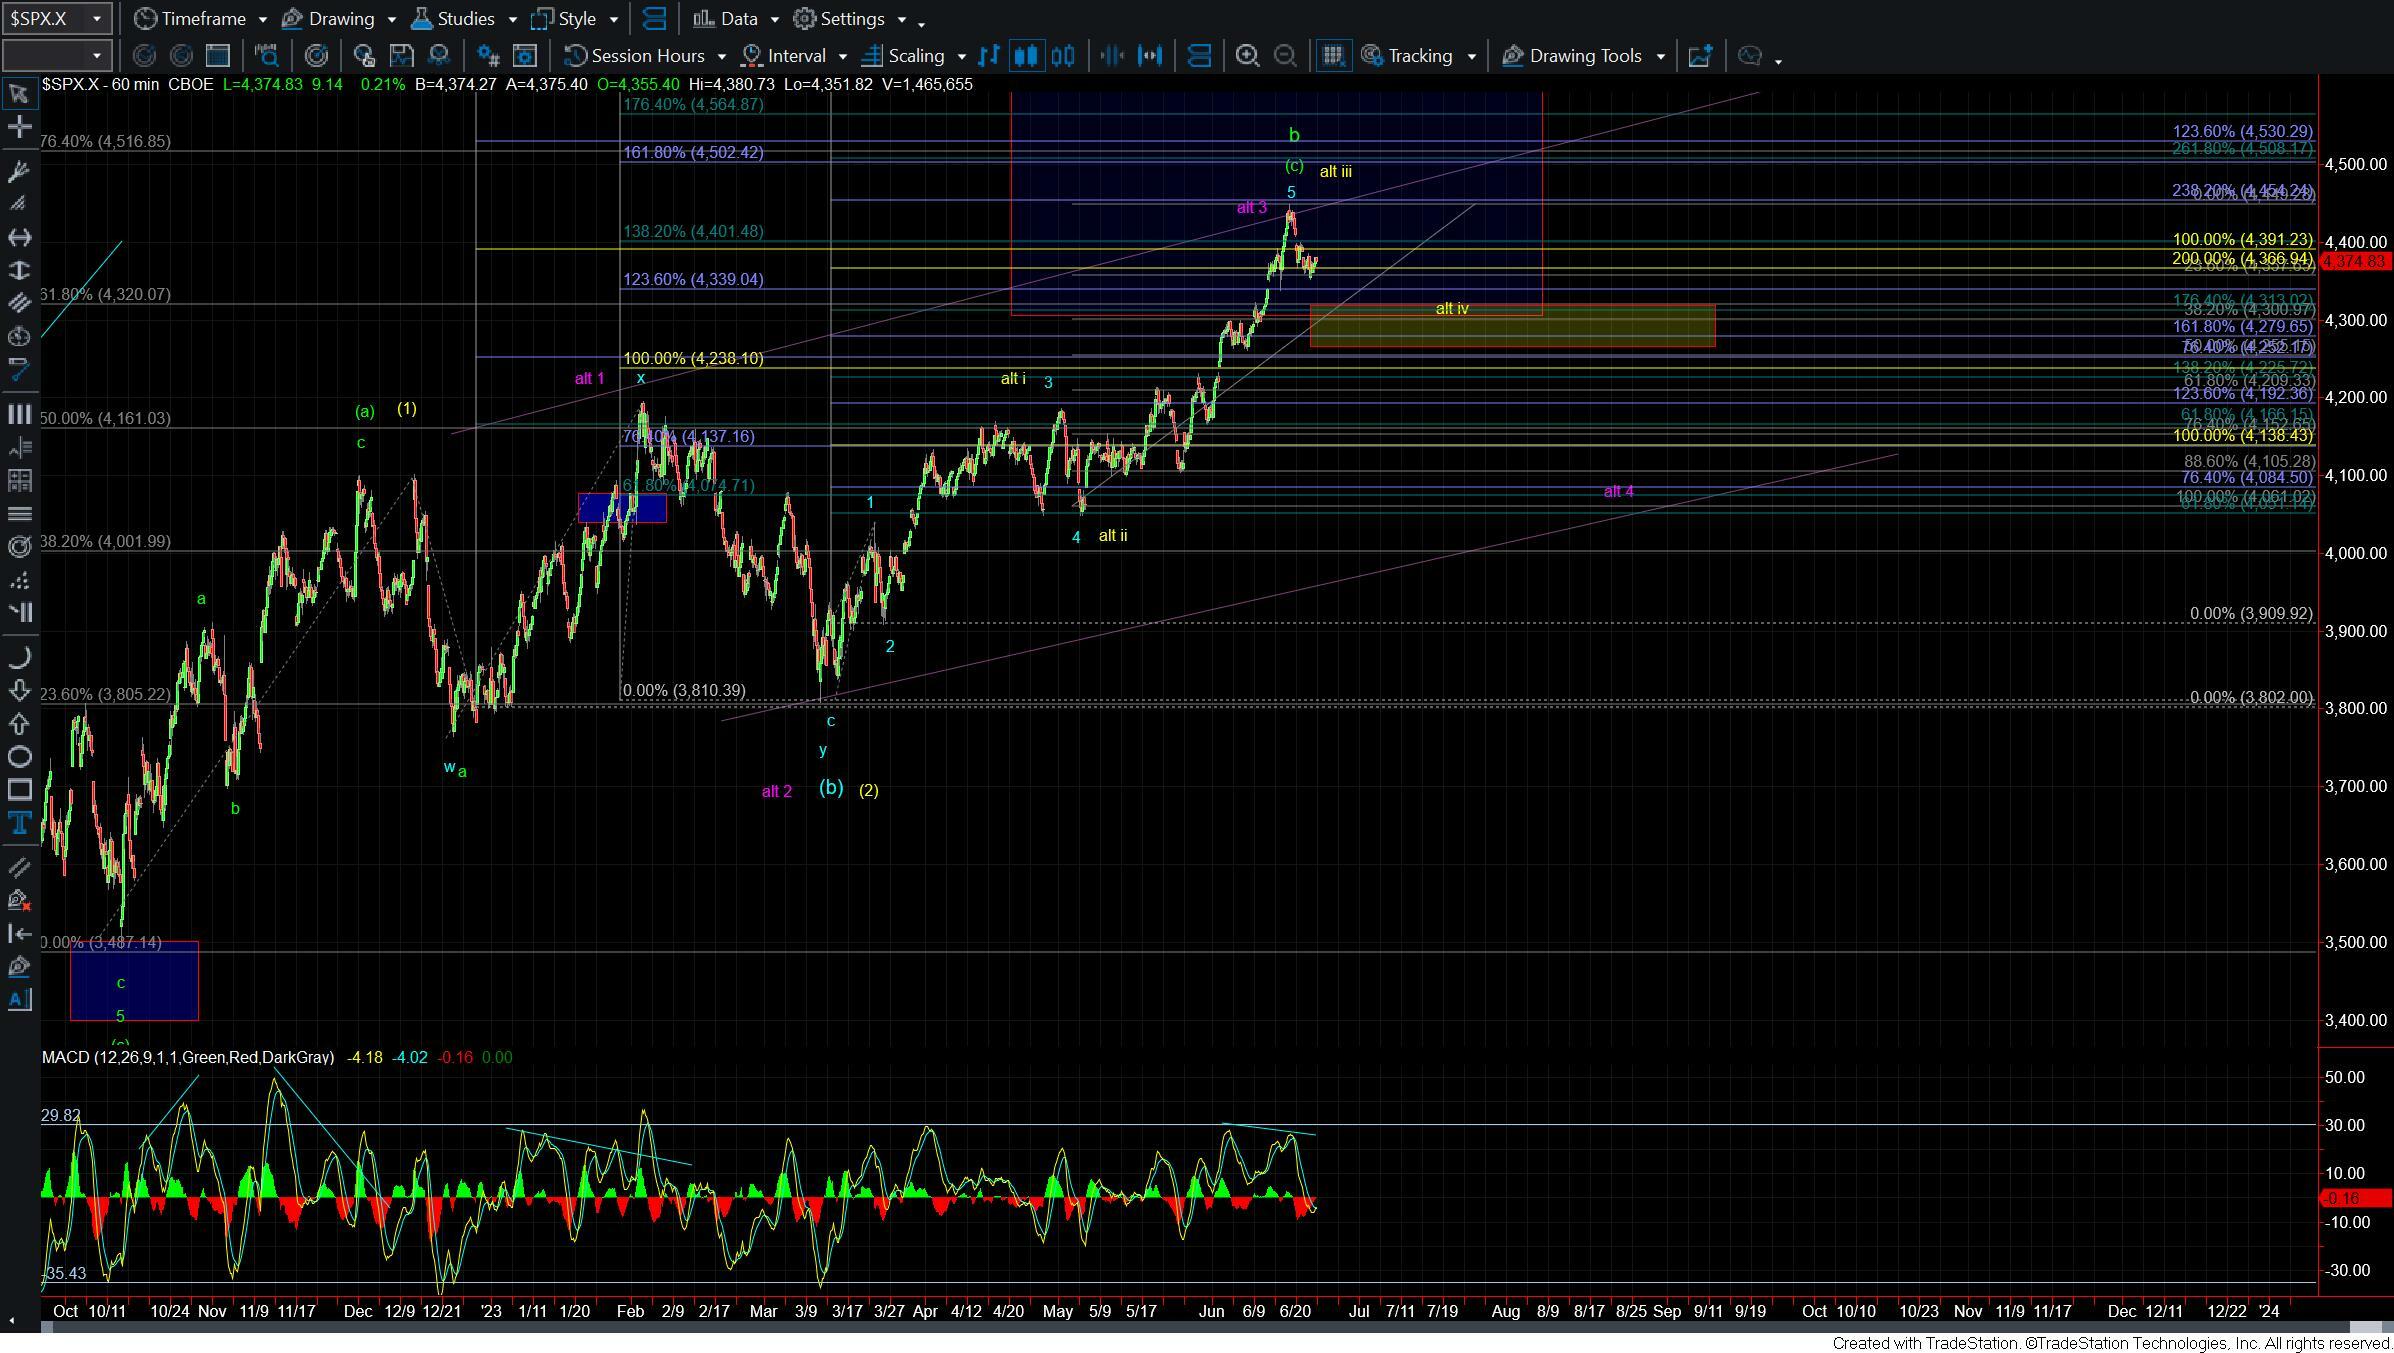
How we follow through to the downside is still going to be key in helping determine whether we have topped in the larger degree wave b per the green count on the 60min chart or whether this move down is simply corrective wave action as part of either the yellow or purple counts as I have laid out and discussed previously.
A full five down off of the high which again would give us the initial signal that we may have topped in all of the green wave b as shown on the 60min chart. If we are unable to see a five-wave move develop to the downside but rather see a three-wave start to the next larger degree move then it would suggest that this leg down is simply a corrective move as shown by the yellow or purple counts as laid out and discussed previously on the 60min chart.
While we do still have initial confirmation of at least a local top being in place we still have a bit more work to do to give us further confirmation as to whether we have indeed topped in the larger degree wave b or if we still are going to see higher levels. The parameters are still fairly clear at this point and we should have an answer as to which path this is following once we fill out the next larger degree move down off of the highs. From there it is simply a matter of following the pattern and fibs as we move through the price levels.