Market May Try To Break Out
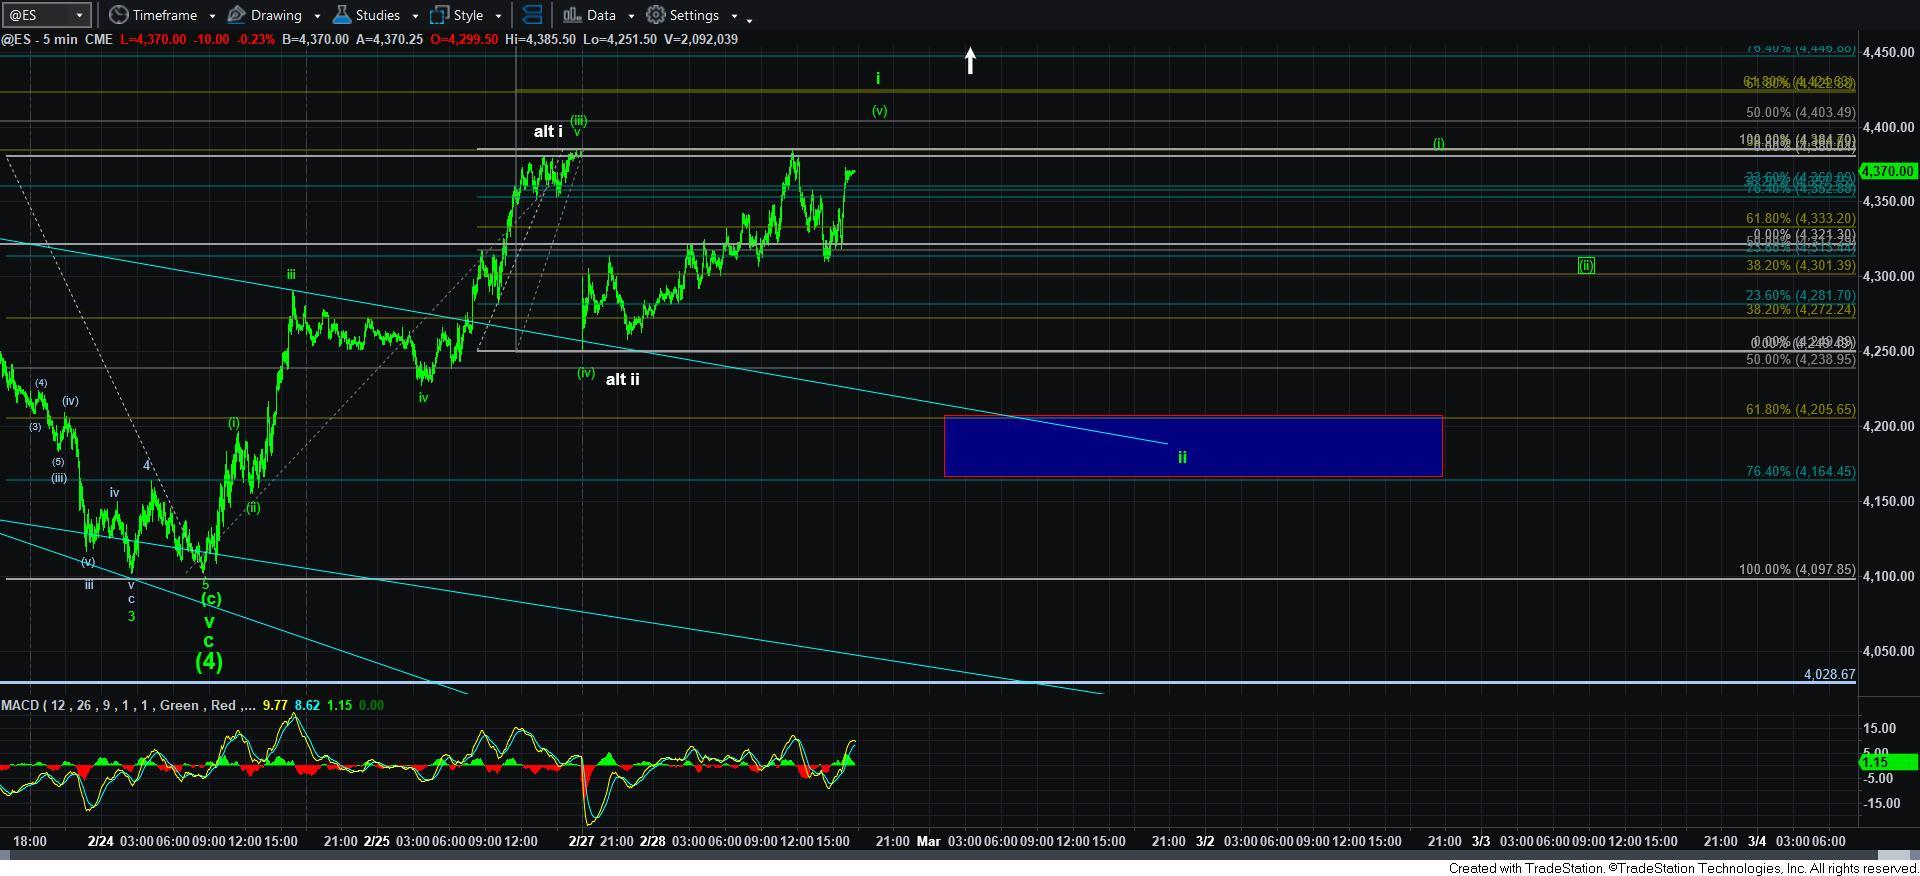
I will start this update with a reminder that surprises happen to the upside in a bull market. That being the case, whereas we have potential for an initial 5-waves having completed in the ES on Friday, the gap down on Sunday night may have been our 2nd wave. This is the most aggressive bullish consideration have on the chart, and have noted it as the white alt i-ii structure on the 5-minute ES chart.
In order for this potential to gain in probability, we would need to see a strong move through the 4425ES region. The reason that is our resistance for this count is because a 5th wave really does not exceed the size of .618 of waves i-iii. That is the 4425ES region in our case.
The fact we did rally today and can make a higher high does fit the SPX cash chart a bit better, as it would “look” better with a higher high for a nicer 5-wave structure off last week’s low.
So, it leaves me with pretty solid parameters again. As long as we remain below 4425ES, then I can reasonably expect more of a wave ii pullback. And, as it stands now, support for that wave ii is between 4165ES-4205ES region. As long as we remain over that support, I am maintaining the green bullish count as my primary, which assumes that wave [4] is done.
Should we see an immediate break out through 4425ES, then it opens the door to a rally back to the highs to complete wave 1 of wave [5] of [iii].
It would take a break down below the wave ii pullback support box to suggest that we have a lower low coming in wave [4]. For now, that is my alternative count.
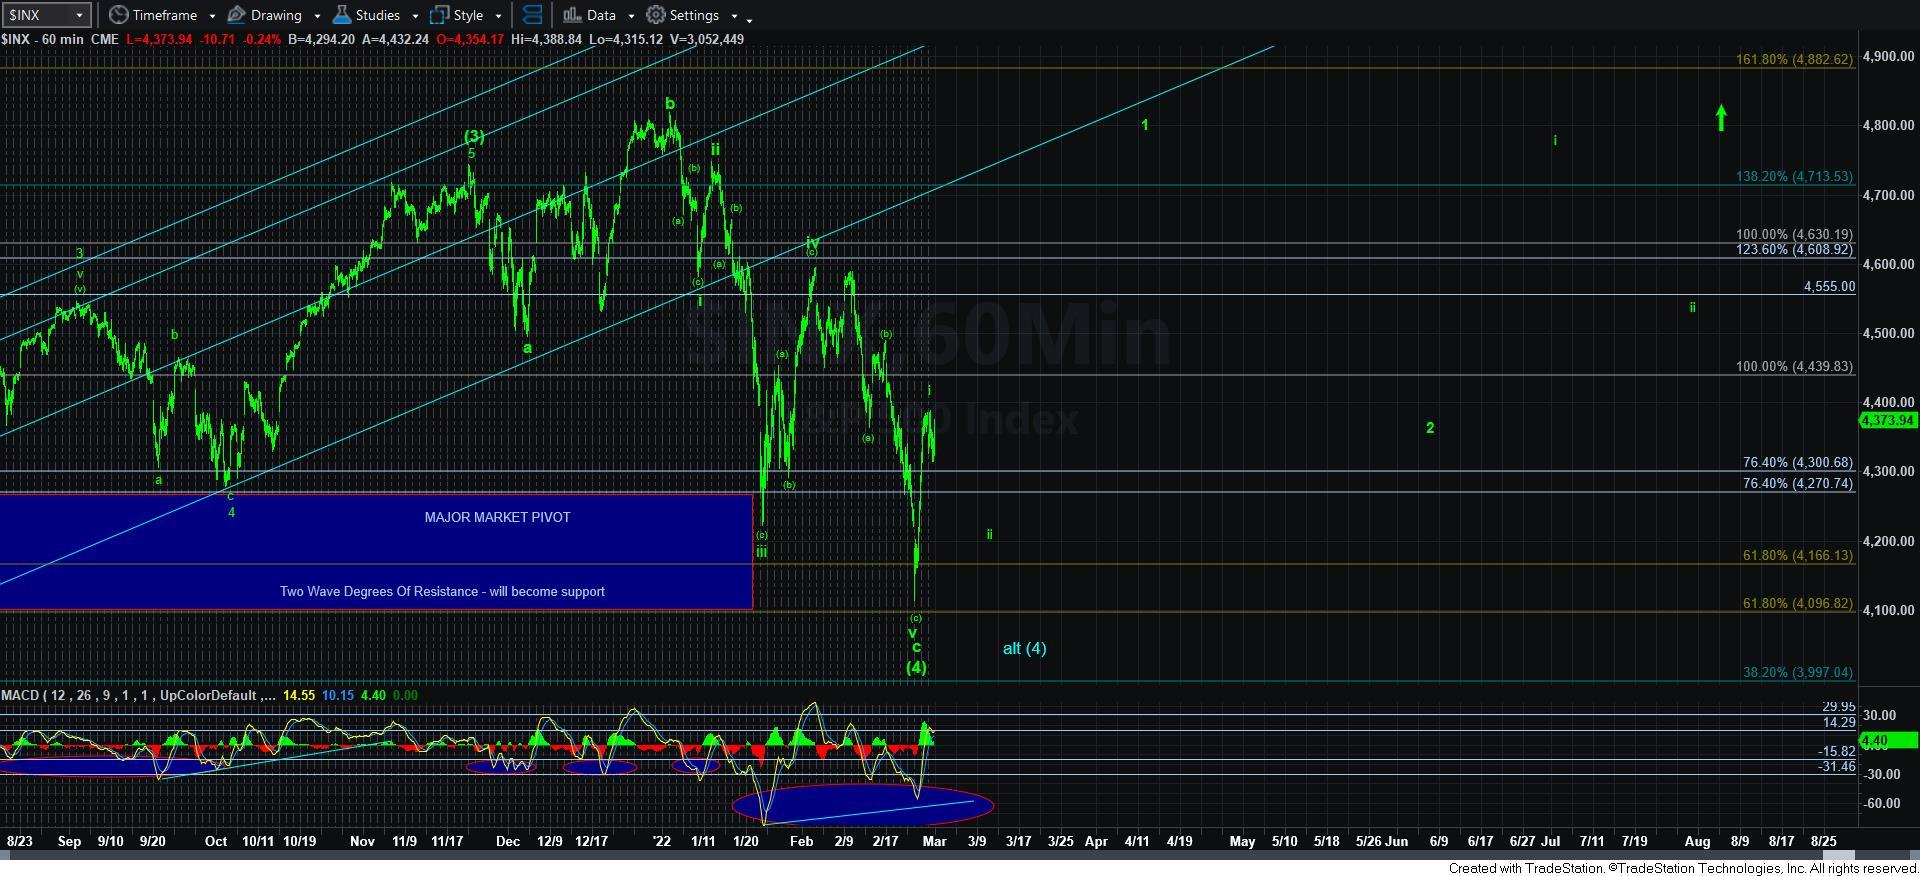
Lastly, keep in mind that even if we rally back up towards the high to complete wave 1, it is unlikely that we will see a major break out until we complete waves 1-2, followed by wave i-ii within wave 3, as outlined on the 60-minute chart. So, we may not be seeing a major break out in the market until the summer, or even as late as the early fall season.