Market Making Stretch Further Into The Resistance Zone
 By
By
Today the ES opened up fairly flat having seen a high-level consolidation pattern overnight. So although the markets remain overbought on the larger degree timeframes this high level consolidation pattern was giving us an early sign that the move was not quite finished on the more micro levels. This did indeed prove to be the case as the market pushed higher in the late morning session having extended up over the 4300 level in what we still count as an extension of the wave (iii) up off of the June lows.
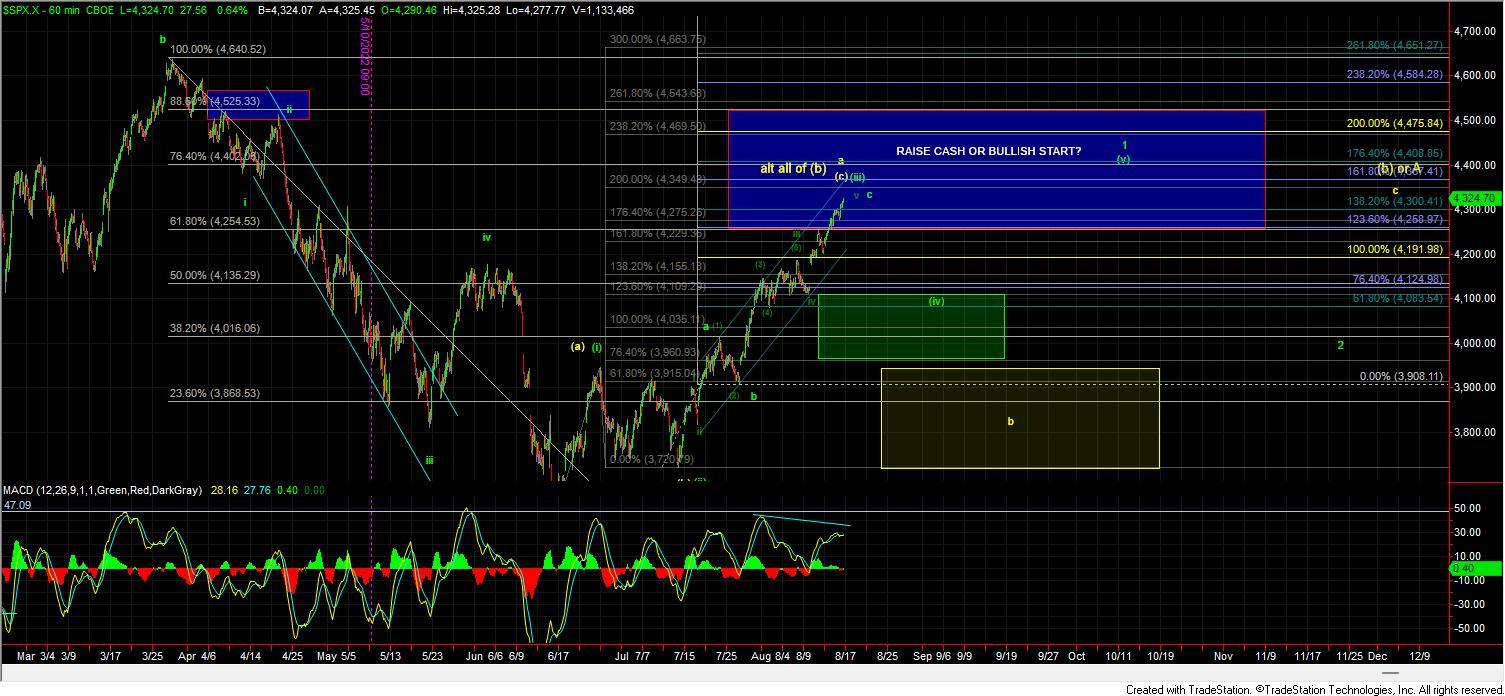
From a Fibonacci perspective, we are now trading just over the 138.2 ext from the wave a up off of the 3720 low and just under the 200ext of the wave (i) off of the 3630 low. While not unheard of it is quite rare to see a bullish wave (iii) or (c) in the equity markets extend much beyond the 200ext of the wave (i). So while I cannot say with certainly until we begin to break support it would be a rare event to see this extend much beyond the 200ext at the 4349 level in the wave (iii). Streach
From a technical perspective the MACD on the 60min chart is starting to roll over now and is still holding it's negative divergence and the MACD on the daily chart remains overbought. We are also seeing divergence forming on the smaller degree timeframes with the last four highs on the ES 20min chart having divergent highs on the MACD.
So again while this grind higher has continued to extend beyond the ideal target levels bigger picture we are still well within the larger degree resistance zone that was laid out when this was trading near the lows in June and the base case for a pullback in either the green or yellow counts remains unchanged. The parameters for those counts on the larger degree timeframes remain unchanged from yesterday.
From a smaller degree perspective, I would now want to see a break of the 4250 level followed by a break of the 4200 level to give us the initial signal that we have indeed topped with again the larger degree parameters laid out below.
Yellow Count
As noted previously the Yellow count would suggest that we are following an ABC up off of the June lows with the wave (c) of that ABC coming into completion near current levels in the form of an ending diagonal. As it is typical for the reversal out of an Ending Diagonal to be quite sharp back to the origination point if we are indeed following this yellow count I would expect to see a sharp move lower that ultimately targets the 3736 level below. I would want to see this move below the 4000 level followed by a break under the 3960 level to give us confirmation that we have indeed topped in this yellow count. Again this should be a fairly swift reversal to the downside under this yellow count so If we do break under the 4000 level but see a more muted move down then I think it would become more probable that we are following the green wave (iv) retrace.
Green Count
Under the green count, we should see a pullback towards the 4124-3960 region and that pullback should take the form of a three-wave move. We should however see another higher high back over the current high to complete a potential leading diagonal up off of the lows. The initial move down off of the highs will likely be very similar to that of the yellow count but again the drop will not be nearly as sharp or deep before turning higher once again. Additionally, once this does bottom in the wave (iv) the final leg up for the wave (v) of 1 is likely going to give us more sloppy action as it should take the form of another three-wave move to fill out the last leg of the leading diagonal. I will note that with this continued push higher I have moved support up to the 4124-3960 region up from the 3950-3900 zone that I had been watching previously. Otherwise, this count remains the same as before.
I will continue to monitor both the pattern and the price levels as this market develops over the course of the next several days. In the meantime being patient will continue to remain key here and although the market continues to grind higher our perspective of where we are in the count and what should come next remains unchanged.