Market Making Everyone Scratch Their Head
Break out. Break Down. Up. Down. This market has been all over the place within the last two months. This bear battle has had something for everyone.
You see, what has caused these “problems” is that we are attempting to trade out of a 4th wave. Normally, they are tough to trade out of on their own, since you are not always certain when they have completed. But, when you have a bottoming pattern as we had this past summer and early fall, it increases those ordinary complications infinitely. This is why we have been so careful to make sure that this 4th wave has concluded, and that we are in the 5th wave of primary wave 3.
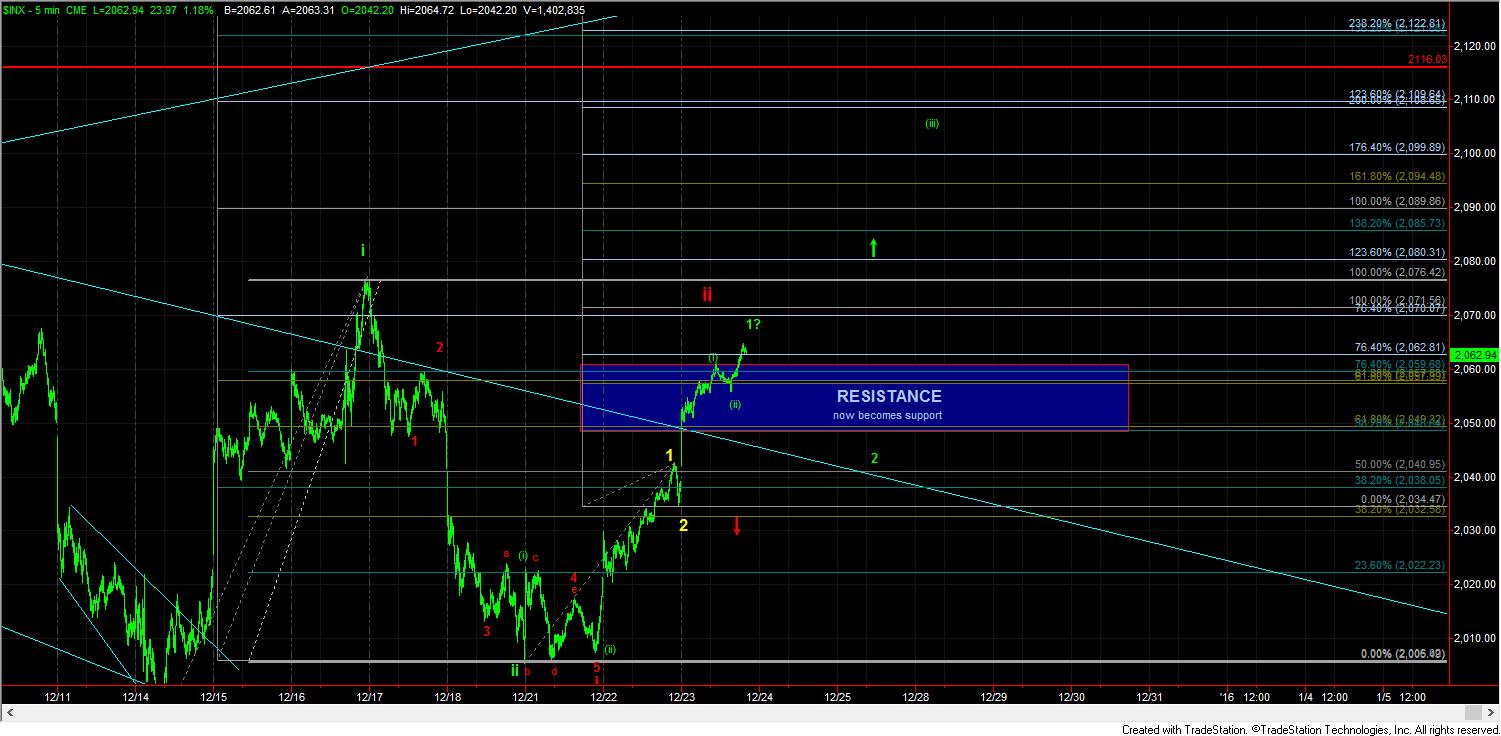
Earlier this week, the market pushed the bulls to their limits and came within one squiggle of providing us with a strong and clear 5 wave move off the recent highs. However, it was not able to complete that last squiggle and, at best, left us with an unreliable “possible” truncated 5 wave structure. And, should the market move through 2077SPX, it would clearly invalidate any such potential.
For now, we have what counts best as a (1)(2) i-ii bullish pattern, with the ii bottoming last Friday at the 2005 level, which was 7 points lower than the level I wanted to see hold. But, from that point, the market has certainly been “acting” as a 3rd wave would, with a relentless rally not providing much in the way of pullbacks. For this reason, I have to continue to maintain my bullish bias, at least until some amount of support breaks.
Furthermore, the way the market has been acting today, it is “possible” that all we get for a wave 2 pullback is the small drop we saw towards the end of the day yesterday. Clearly, that was a very small wave 2 relative to the entire pattern, but sometimes this is how the heart of a 3rd wave works. Should we see a strong move through the 2077SPX level, that will affirm this potential for me.
For now, our upper support resides at 2050SPX, with lower support at 2030. It would take a break below 2030 to even make me consider any bearish perspectives on this chart.
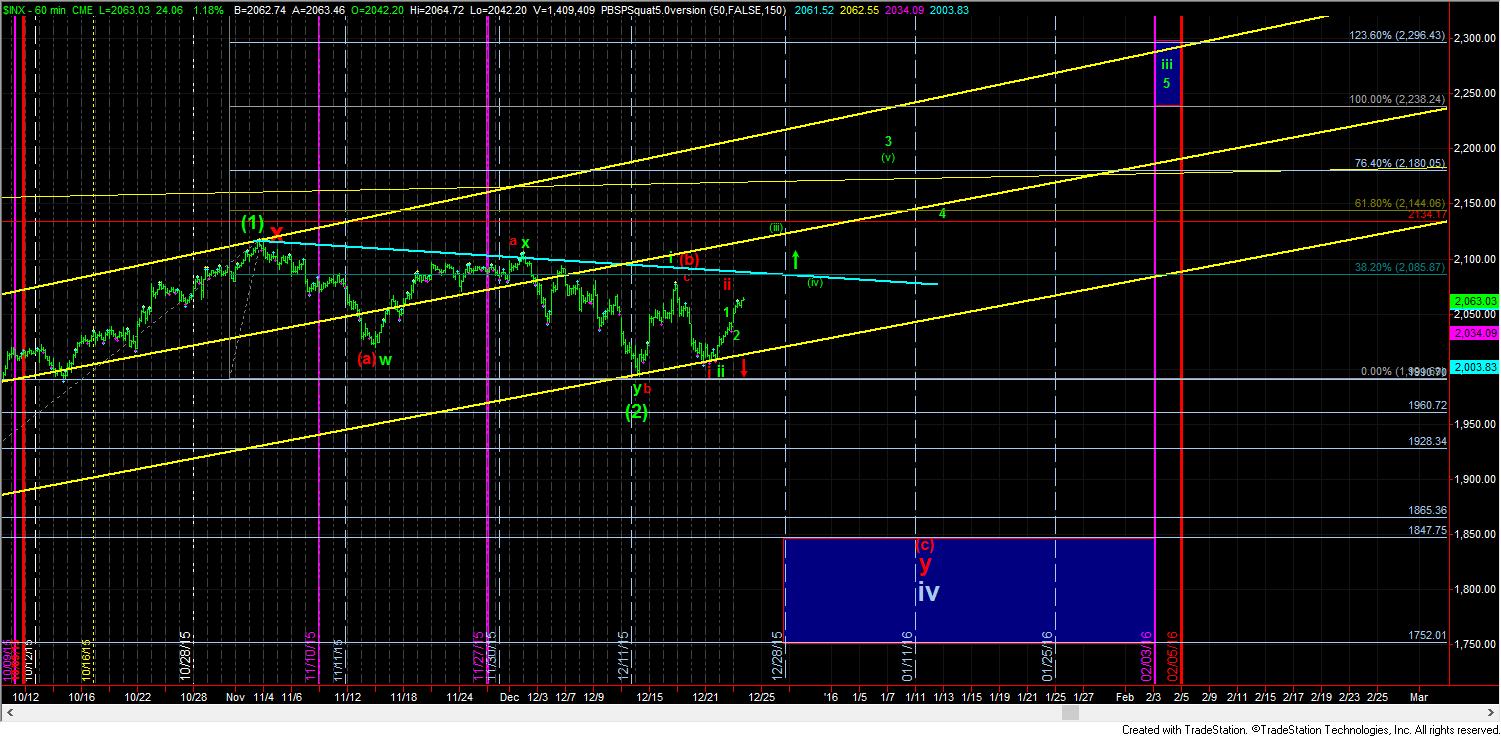
As far as the 60 minute chart, I am “assuming” the smaller 1-2 for now, but, even if we were to see a bigger 1-2 (as presented in green on the 5 min chart), the rest of the bullish impulsive pattern, as presented towards the 2200 region, will generally remain the same.
So, again, until some support begins to break, and the market is able to break back below 2030SPX, I have to give the bullish perspective the benefit of the doubt especially with the manner in which it has been acting for the last several days. The next day or two of market action should clear up the smaller degree counts.
For now, our next resistance region is 2071.50-2076, followed by 2090SPX. Through that region, and we will likely be testing the all-time high by new year’s day. And, again, the market is going to have to break the 2030SPX level for me to consider any bearish possibilities at this time.