Market Levitates To Top of Resistance
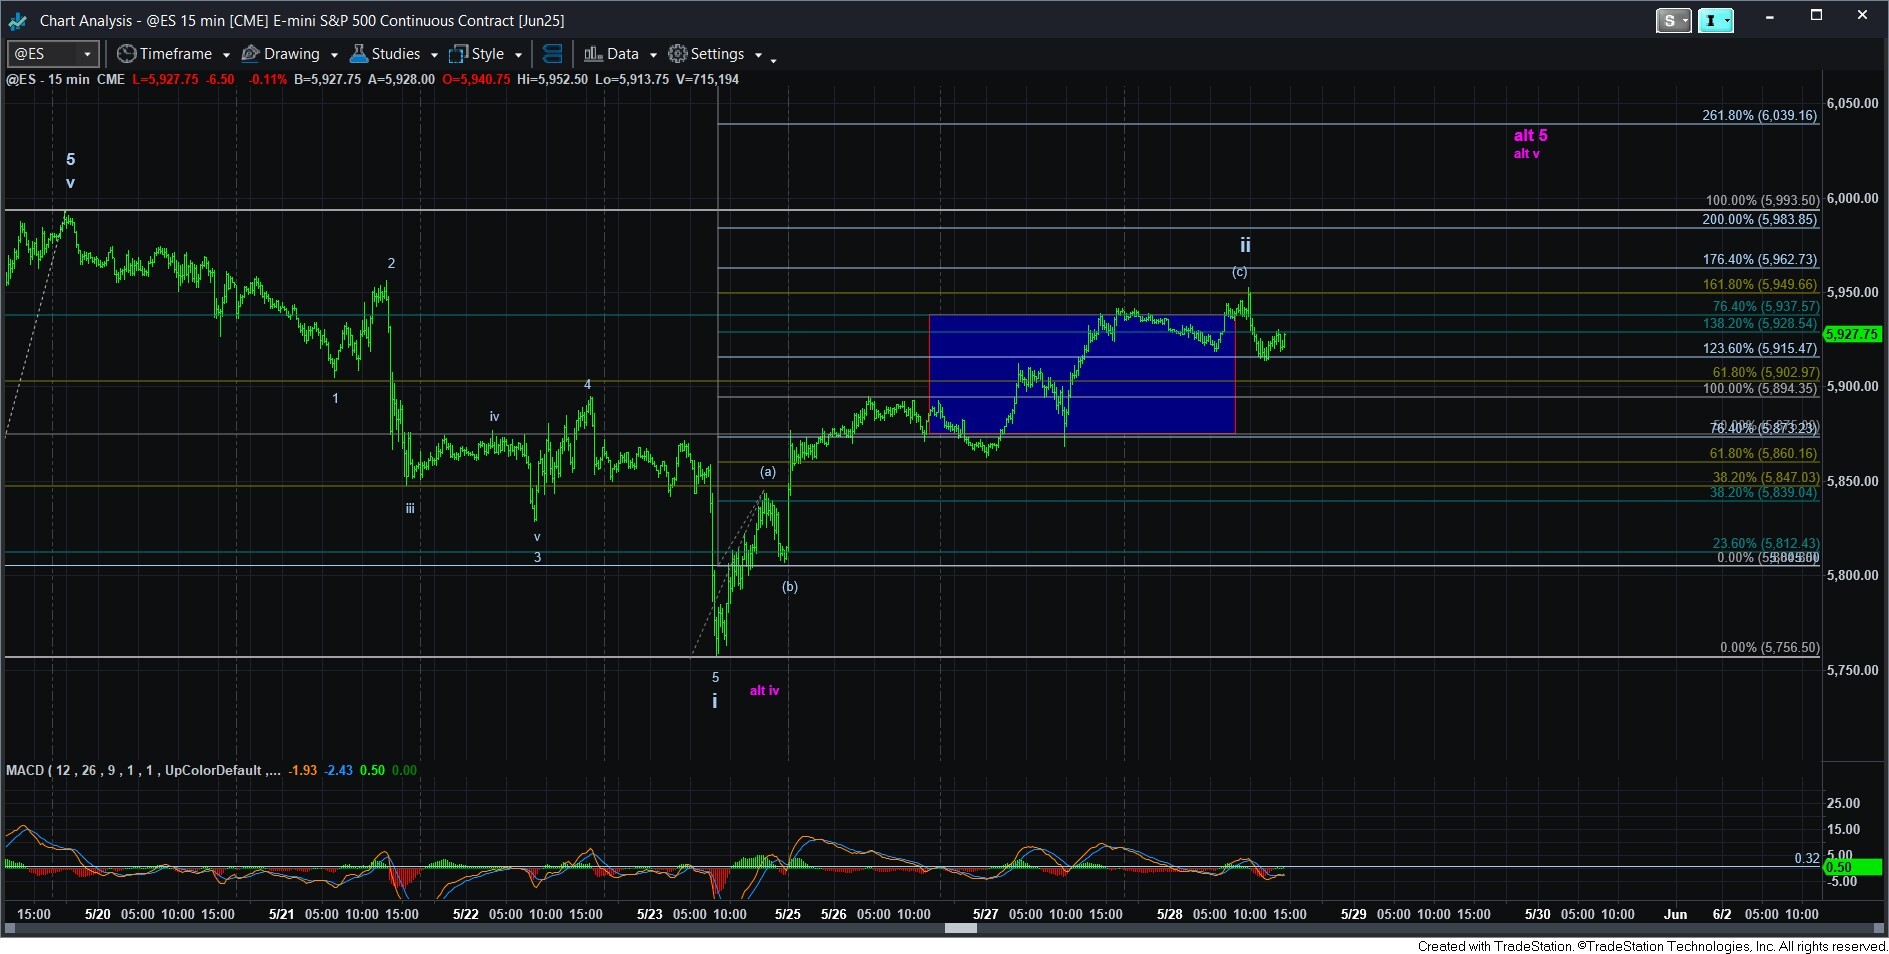
With today’s high, we saw a spike and reversal at the top of our resistance box on the ES chart. And, I think this is a good marker for us.
I would say that as long as we remain below today’s high, I will view it as the top of the [c] wave of wave ii. But, I cannot say that the decline off that high is a clear 5-wave decline. So, we will need more information about the decline structure should we head lower before we can view this count as a high probability.
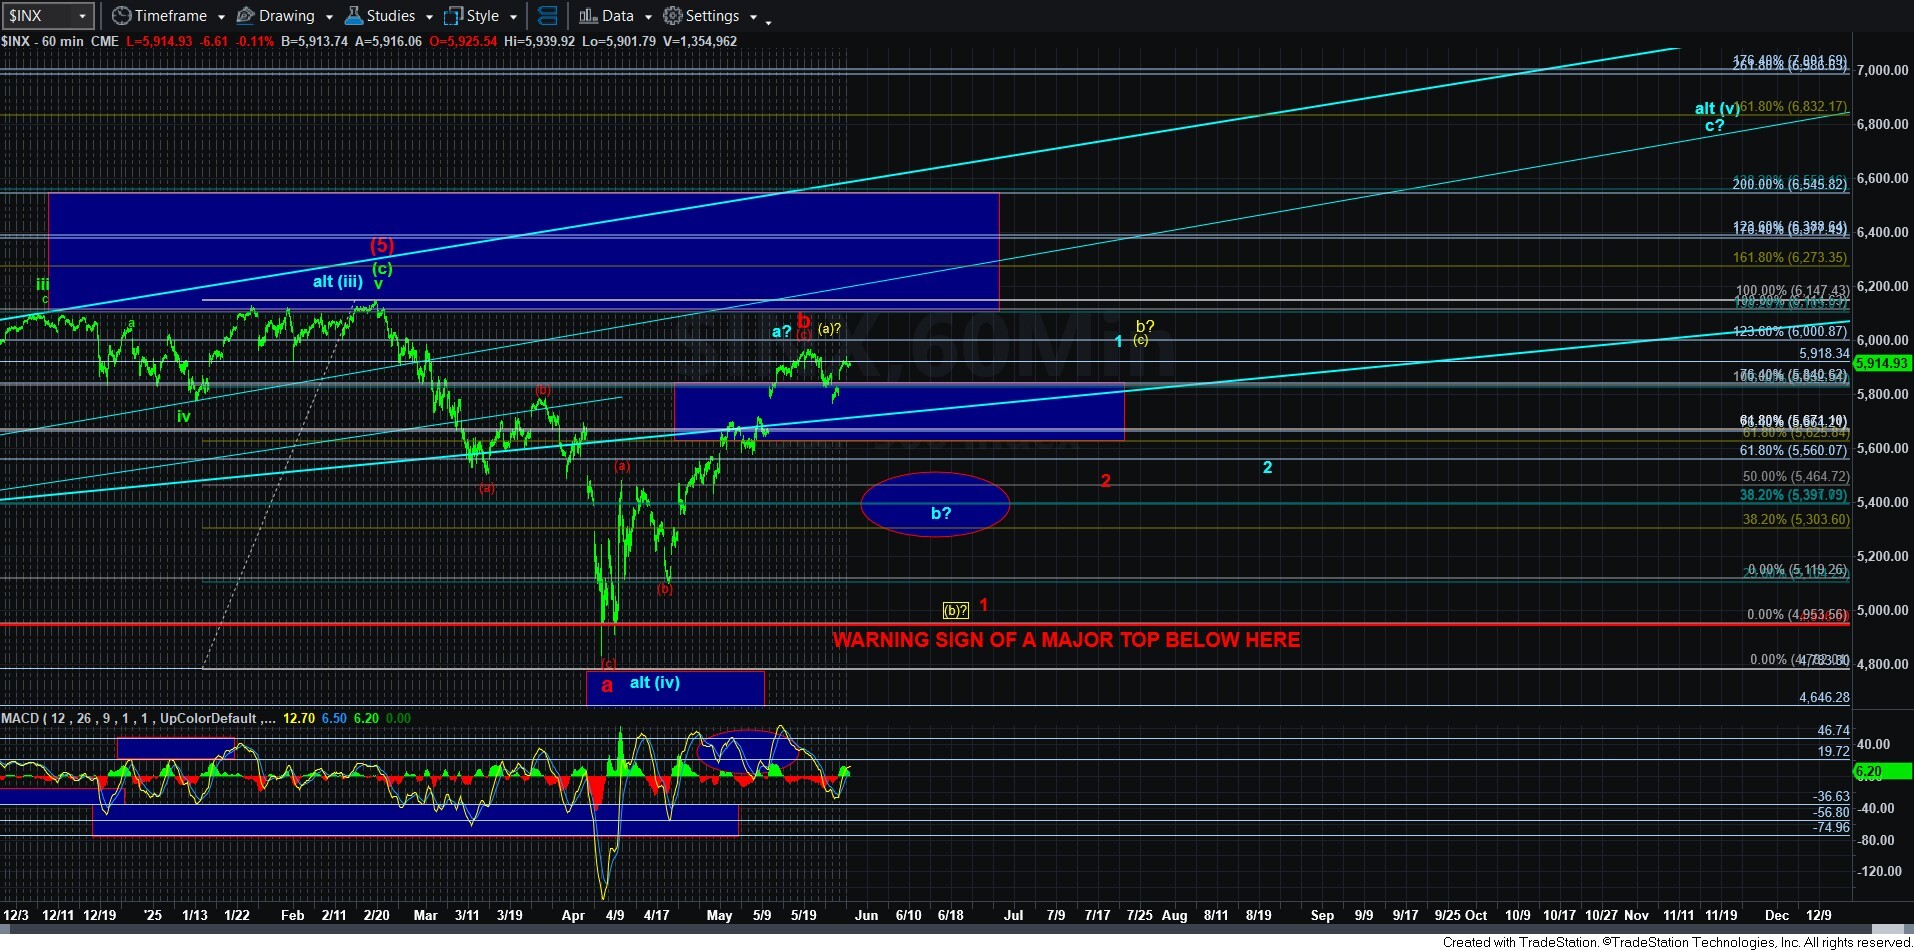
Alternatively, should the market be able to exceed today’s high, then it begins to suggest that the wave 5 has not likely completed. I have provided that alternative on the ES chart in purple. And, that extension would simply complete the red [c] wave on the 60-minute chart (or the yellow [a] wave or blue a-wave in the alternatives).
I really do not have to make it more difficult than that, as the bigger picture remains the same. We need to assess the structure of a larger pullback in order to assign probabilities to the various paths we are tracking. I have outlined these potentials MANY times over the last month.