Market Laying Out Parameters
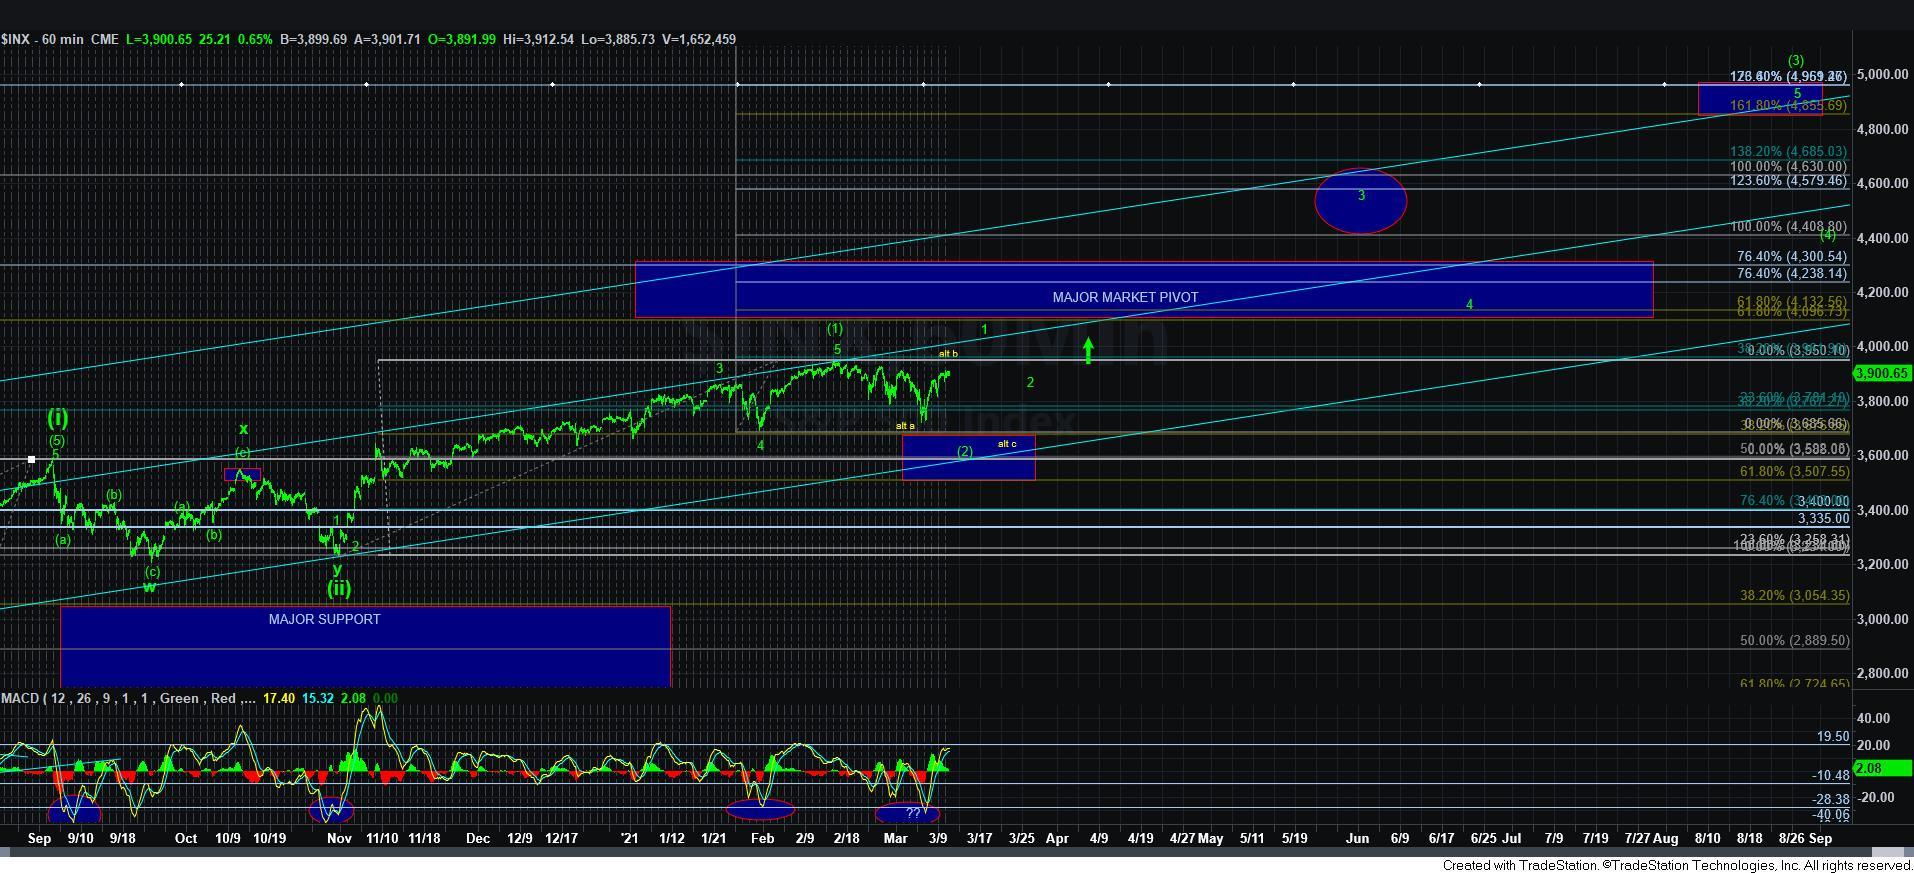
While the micro structure is not terribly clear at the moment, I want to start by again reminding you that this is a bull market with much higher levels likely to be seen in 2021. In fact, my next intermediate target this year is the 4300/4400SPX region, followed by anywhere between 4600-4900, depending on how we develop over the coming months. And, if you want a nice detailed explanation as to how these levels line up in the bigger picture, please review the live video I did this morning for our members.
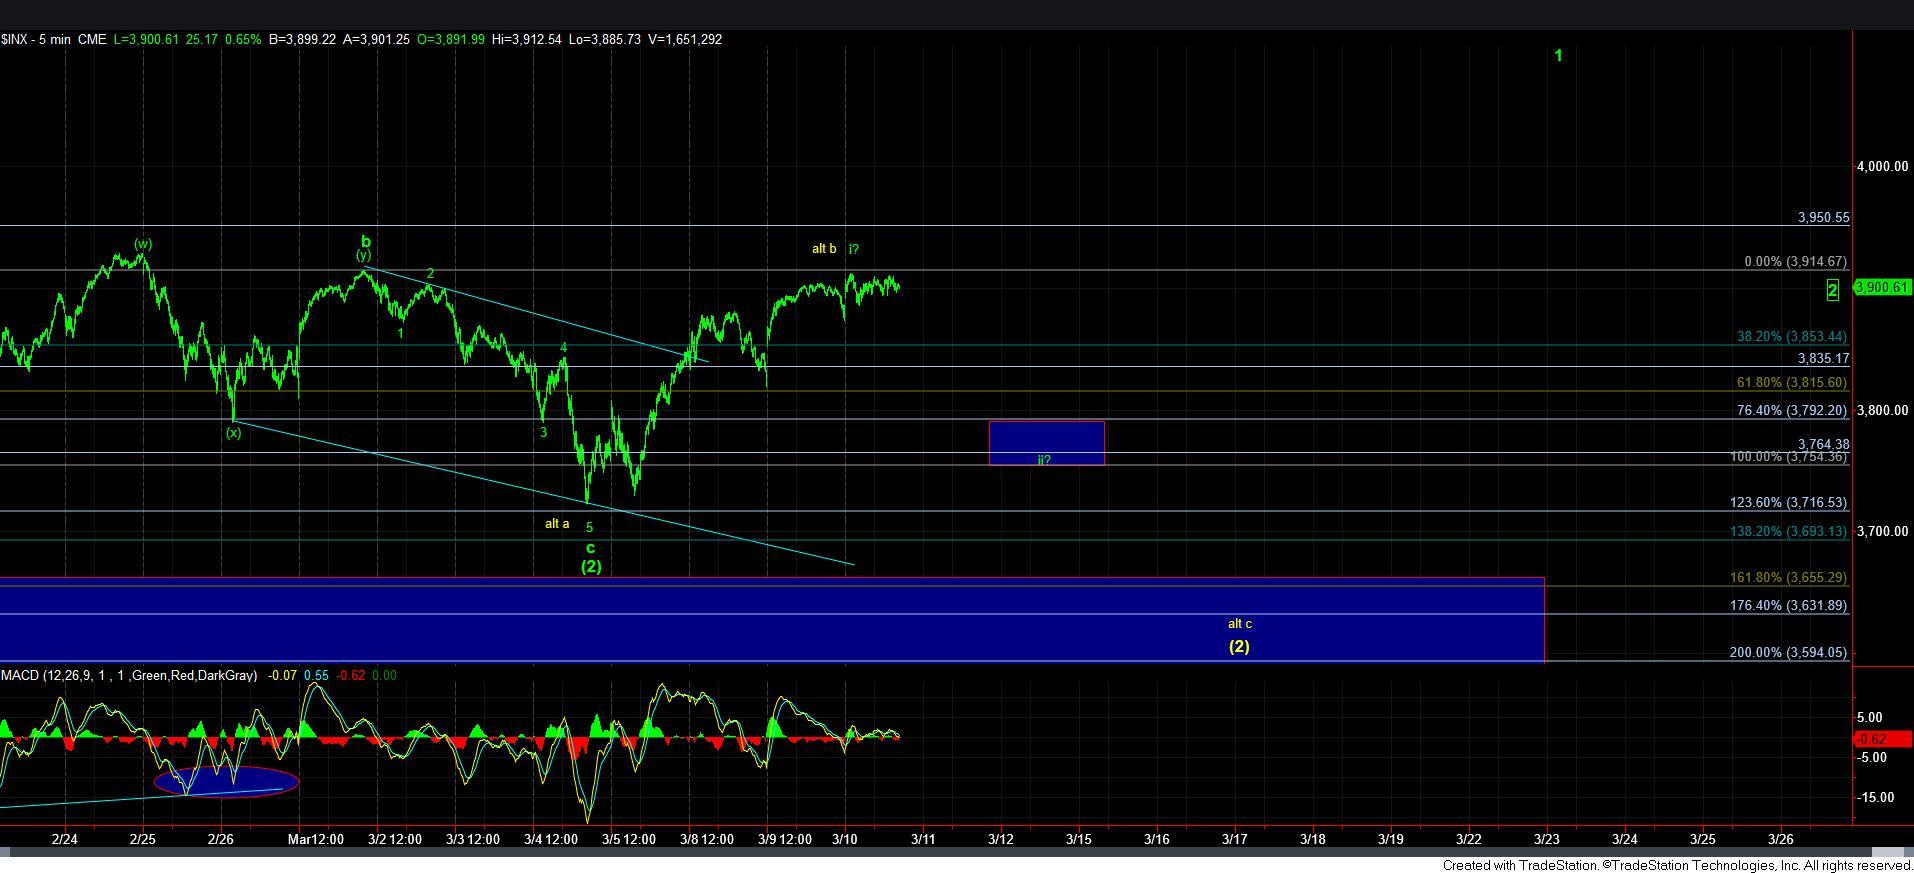
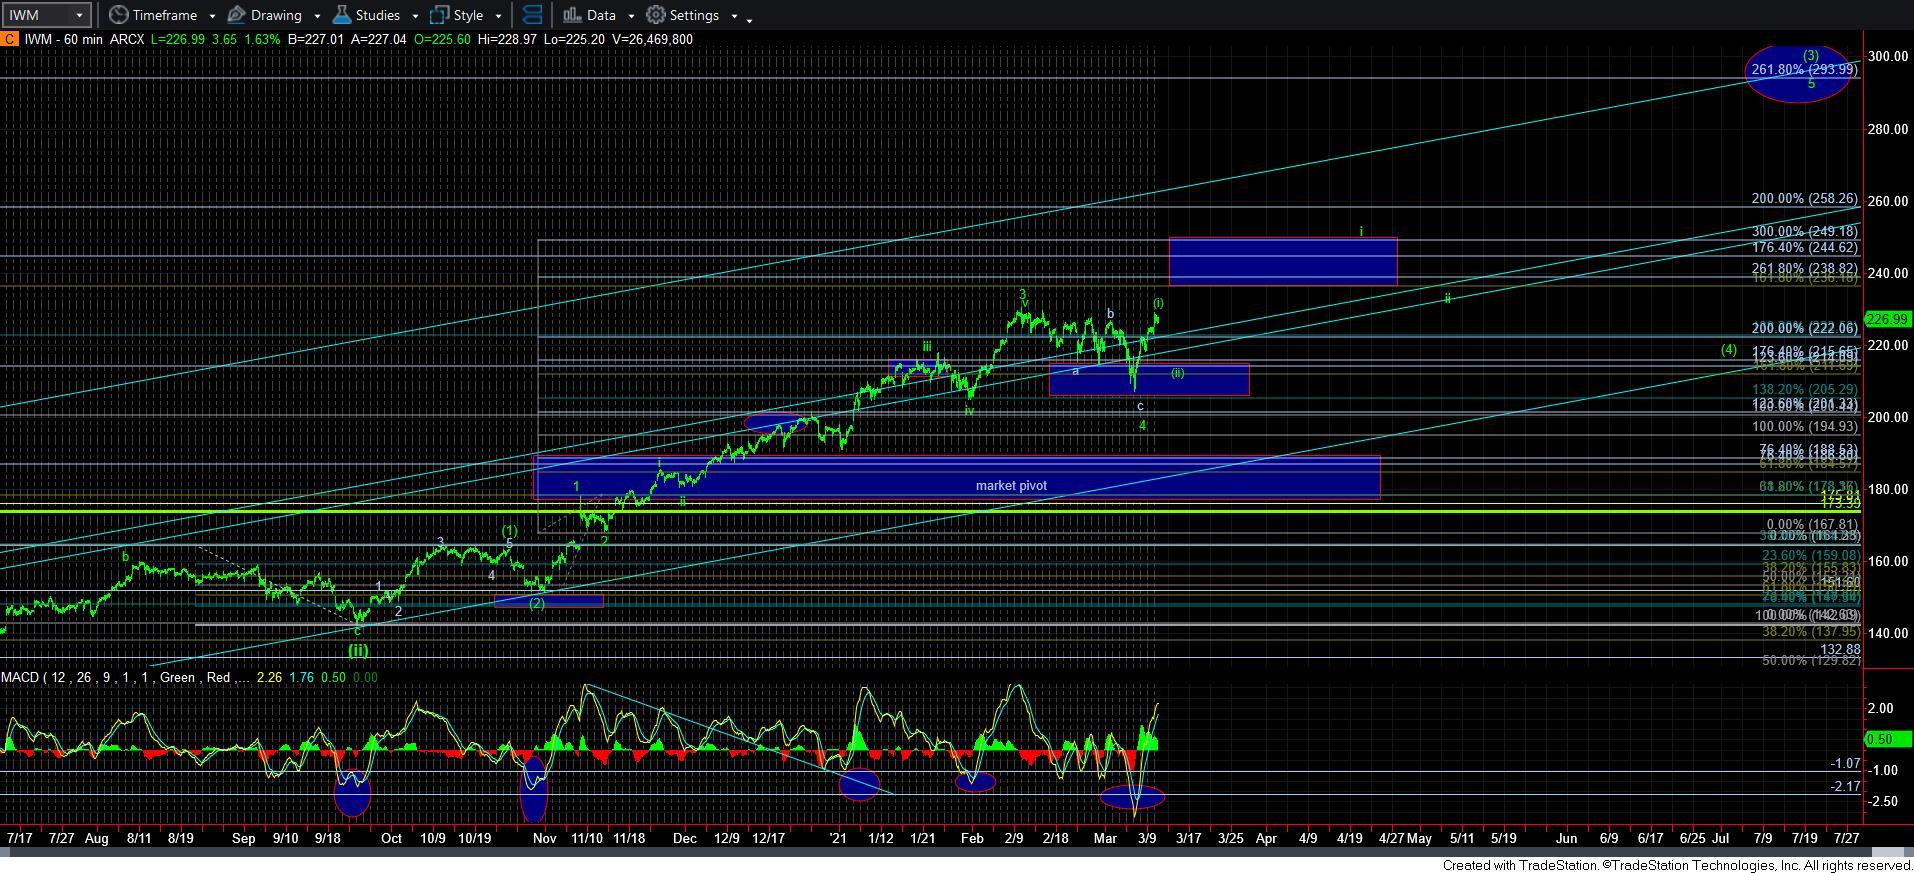
In the meantime, I am still tracking whether wave [2] is done in the SPX, or whether we can still see one more test of the 3675SPX region before we begin the rally to 4300+. As it stands right now, I think the IWM is still clearly saying that it has completed its pullback, and is ready for the next rally phase.
But, within the SPX/ES, the pattern is not terribly clear. Yet, it is still providing us with some nice parameters to follow. So, let’s take this step by step.
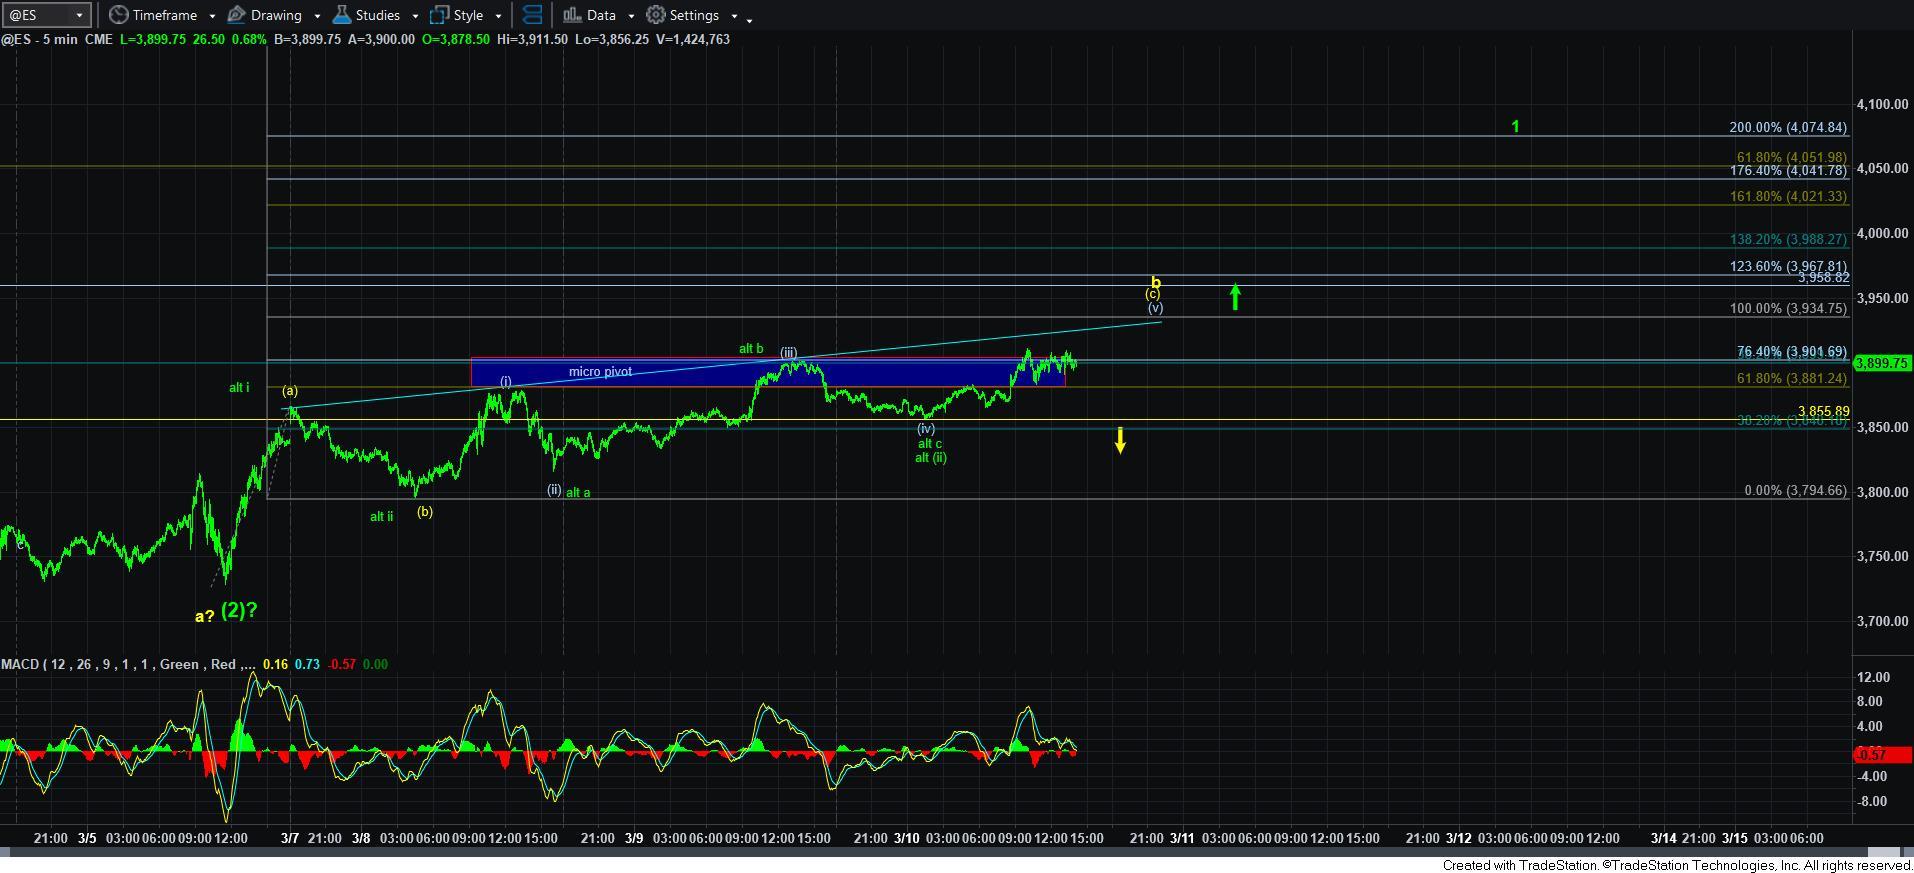
I noted yesterday that as long as we do not see a sustained break of the 3860ES region (I hope you all noted my modification from 3880ES, as I was looking at the wrong wave degree, and apologize for the mistake), then we can still attack the 3935ES region. And, I feel the same way at this time.
But, here are the parameters we are watching. As long as the market respects the 3935ES resistance, then I am going to be looking towards the 5-minute SPX chart and watching how the next decline takes shape. If the next decline is clearly corrective, then we have a i-ii structure for wave 1 of [3], which will likely be pointing us up towards the 4100SPX region to complete wave 1. Thereafter, I would expect a wave 2 pullback towards the 3900-3950SPX region, which is the region we are now meandering within, before we begin wave 3 of [3], with our targets of 4300+.
However, as long as we remain below 3935ES, we still have a reasonable wave structure being presented on the 5-minute ES chart which can suggest this is a b-wave rally, to be followed by a c-wave down towards the 3675SPX region. But, we will need to see an impulsive 5-wave structure break below last night’s low in the ES to make this a much higher probability. While I would love to see a fuller a-b-c structure, as presented in yellow, for wave [2], I question this potential due to the IWM structure. Of course, it is entirely possible that the IWM sees a wave [ii] pullback and holds over its low struck last week, while the SPX makes a marginally lower low to complete a c-wave of wave [2]. But, for now, this is simply a hypothesis for which I have no evidence until we see how we decline.
This brings me to the last point. Should the market break out strongly over 3935ES, then I would have to assume we are rallying towards 4100SPX to complete wave 1 of [3]. And, should the IWM also break out strongly over its prior all time high at the same time, it would likely be rallying to complete its larger wave i of 5 of [3] to the bottom of the next target box overhead.
So, the market has provided us with rather clear parameters right now. 3935ES is our ceiling, and last night’s low in ES is our floor, for now. Should we remain below 3935ES, and break below last nights low in ES, then we will likely be tracking the 5-minute SPX chart outline, and determining if the pullback is a corrective wave ii, or if it is an impulsive c-wave in yellow. However, if we see continued strength through 3935ES, the probabilities being to side with us extending in wave 1 of [3] in a more direct fashion.
Time for Mr. Market to make its decision.