Market Keeping Its Cards Close To Its Vest
With the IWM diverging still with the SPX, it certainly is making it much more difficult attempting to identify exactly how the SPX is going to take us to 3000. And, until we break down below the low struck this week in the SPX, we don’t have a strong signal that the market is entering a pullback, despite my desire to see one.
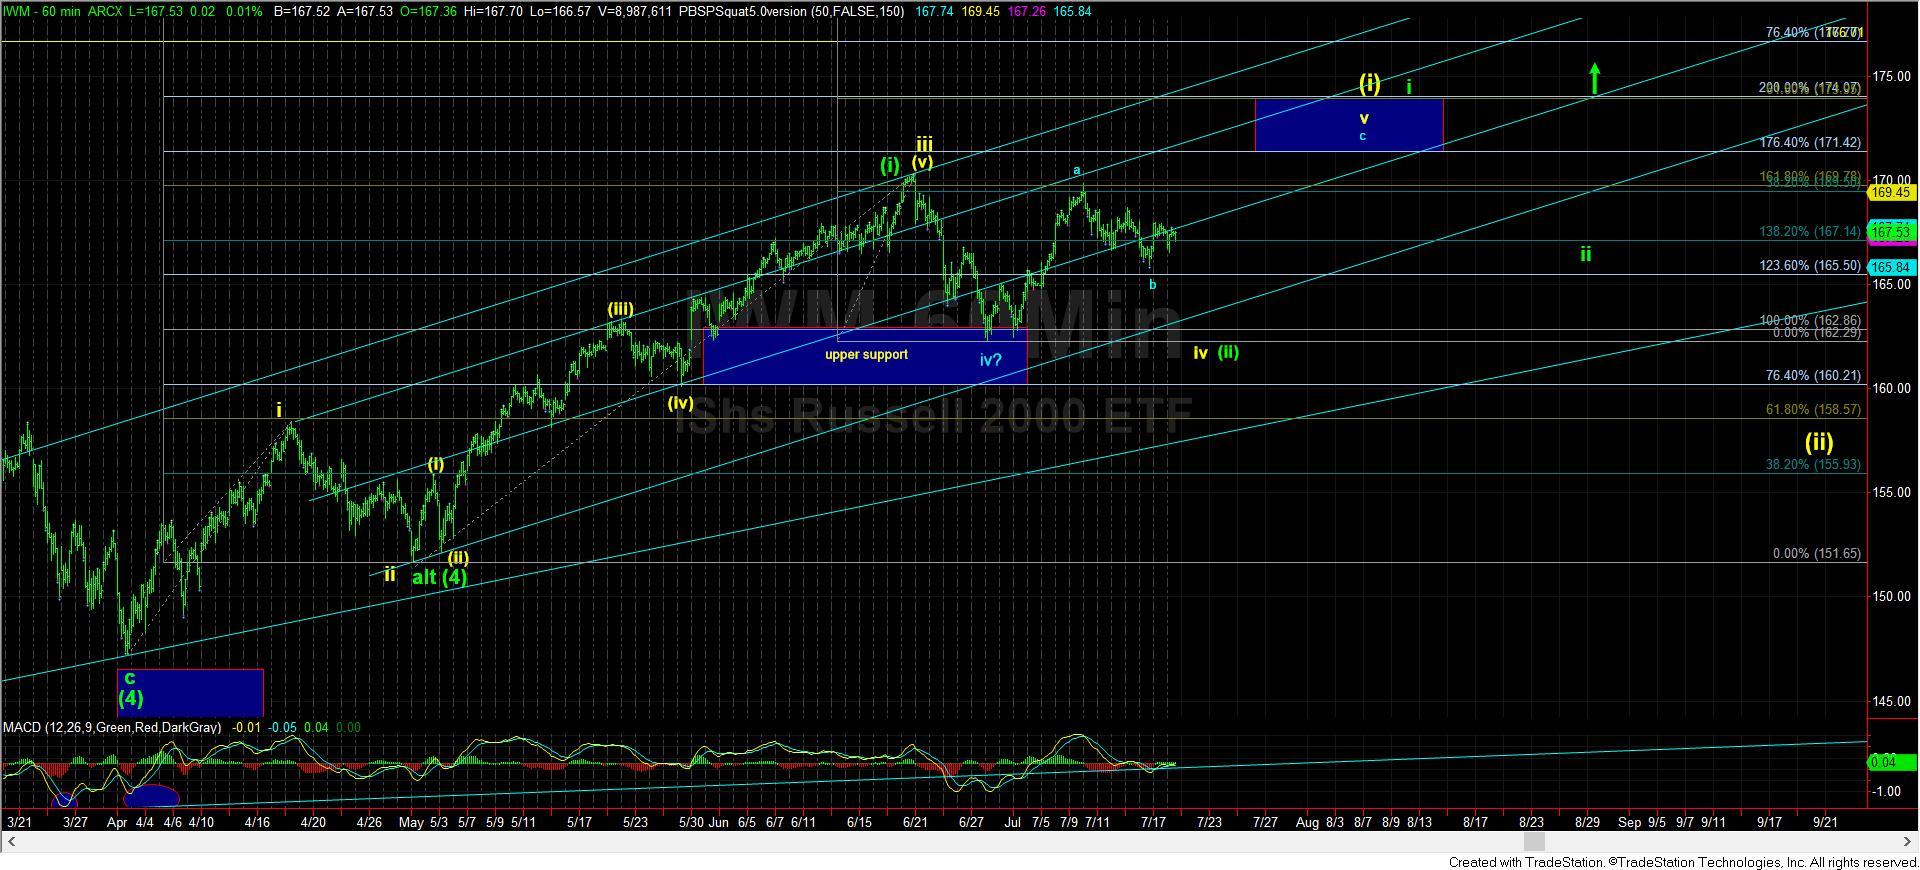
Now, due to the inability of the IWM/RTY to follow through on these downside set ups, I had to start looking at more immediate bullish potential on the chart. Should we see a strong move through 1700 in the RTY, then I have added the blue path on the IWM chart as to how we can complete wave (i) in yellow.
As you can see, this blue path would align the IWM with the SPX and DOW as leading diagonals for this wave (i) of (5). It would also mean that the yellow wave (iv) within wave iii was really a b-wave in an a-b-c structure for the IWM, which would then classify the next rally as a c-wave to complete an a-b-c for wave v of (i). But, until we see a strong break out through 1700RTY, this is only an alternative potential. And, again, it is something to which I must give stronger consideration with the inability of the RTY/IWM to follow through on its recent downside set ups. This week should decide this potential.
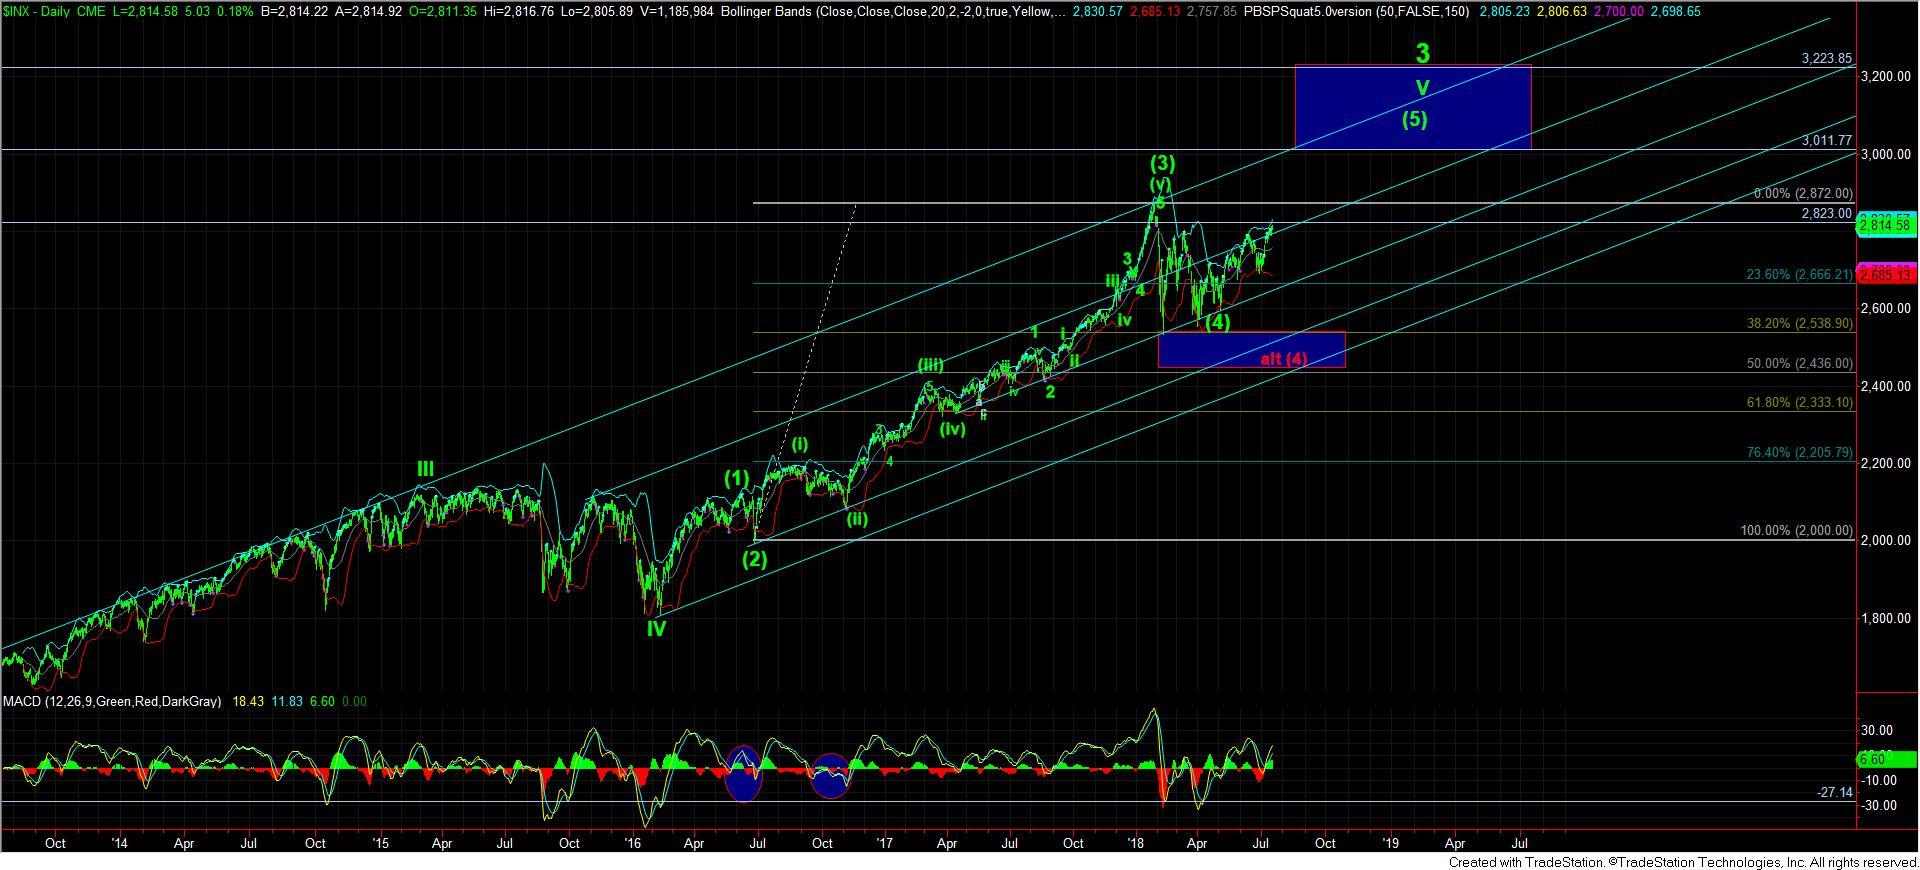
But, overall, our expectations remain the same. I still think we are on our way to 3000 in the SPX. And, how much higher over the 3000 level will depend on how the market shakes out over the coming month. If we are able to see a much bigger wave (ii) pullback into the latter part of the summer, then it opens the upside towards the 3225SPX region. However, the inability to see a bigger pulled, and we then see the IWM rally strongly through 174, then it would suggest we are taking a direct path to those higher highs, and we can top out as early as the end of this year.
For now, I am going to wait to see how this region resolves before I get back in an aggressive way on the long side.
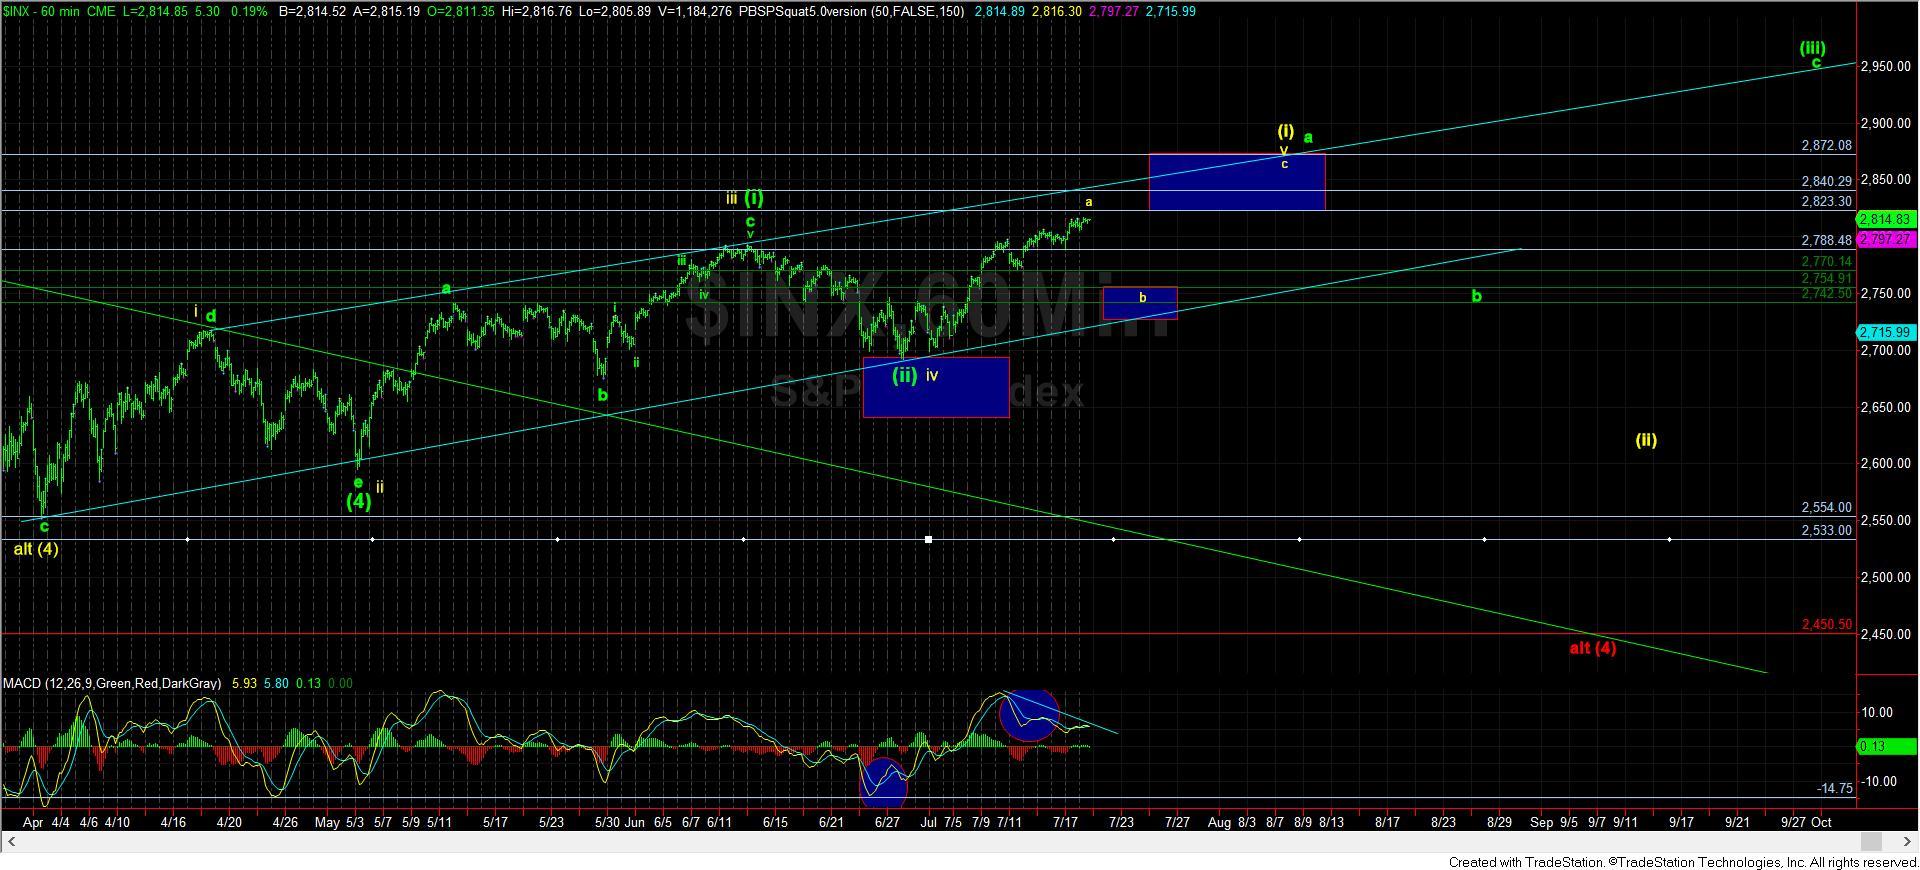
Lastly, while it is still a very low probability, it deserves to at least be brought up. We have a point of confluence in the 2823SPX region which can point us down to the 2450SPX region in what we have classified as the red count on the SPX. The main reason we have had to retain it is because of the non-clear manner in which we bottomed. It has still left questions as to where wave (4) completed. For now, we have assumed that it completed either in yellow or in green, the difference of which will tell us if we top at 3000 or much higher in 2019. But, it still has left a small opening for a bigger 4th wave. And, if we top at 2823SPX and see a CLEAR 5 wave structure to the downside off that region, then this potential will become a stronger consideration. Until such time, it is still worth noting, but as a much lower probability potential at this time.