Market Is Still Trying To Find A Top
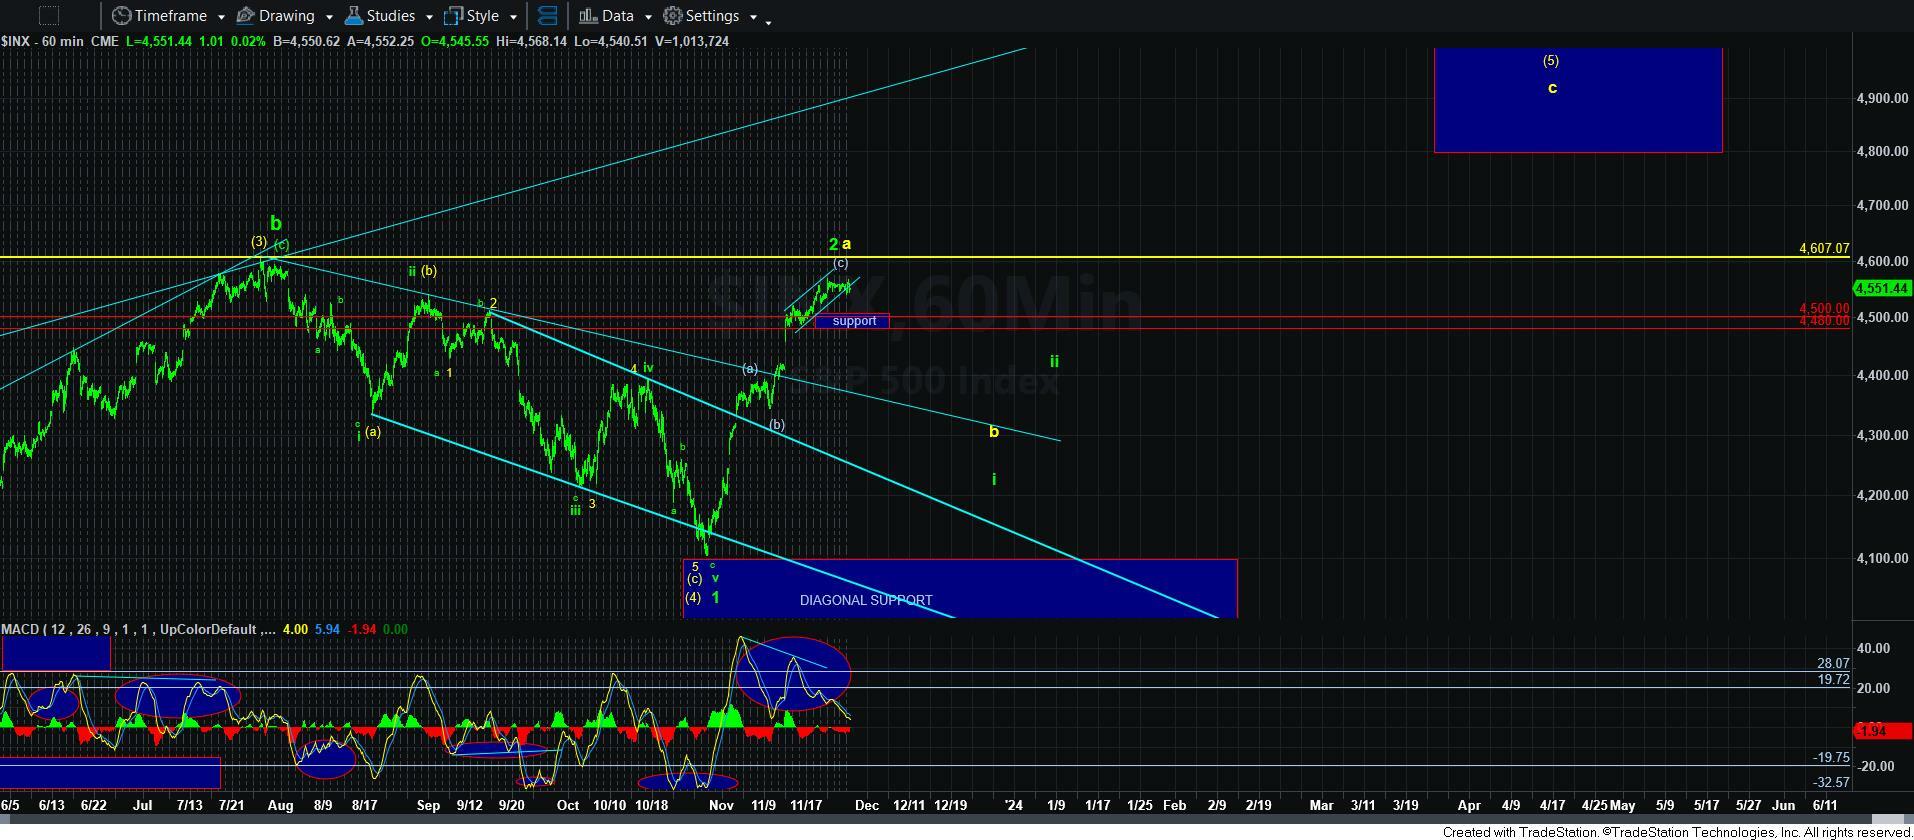
Are we stretched to the upside in the move off the 4100SPX region? Yup. Can the market still make an attempt to stretch higher? Yup. In fact, as I outlined in the weekend update, the [a]=[c] target is in the 4630SPX region. And, that is the most common relationship we see between the [a] and [c] waves in a corrective structure. For this reason, I have been waiting for a break of support to confirm that a top is in place at a point that is less than the [a]=[c] ratio.
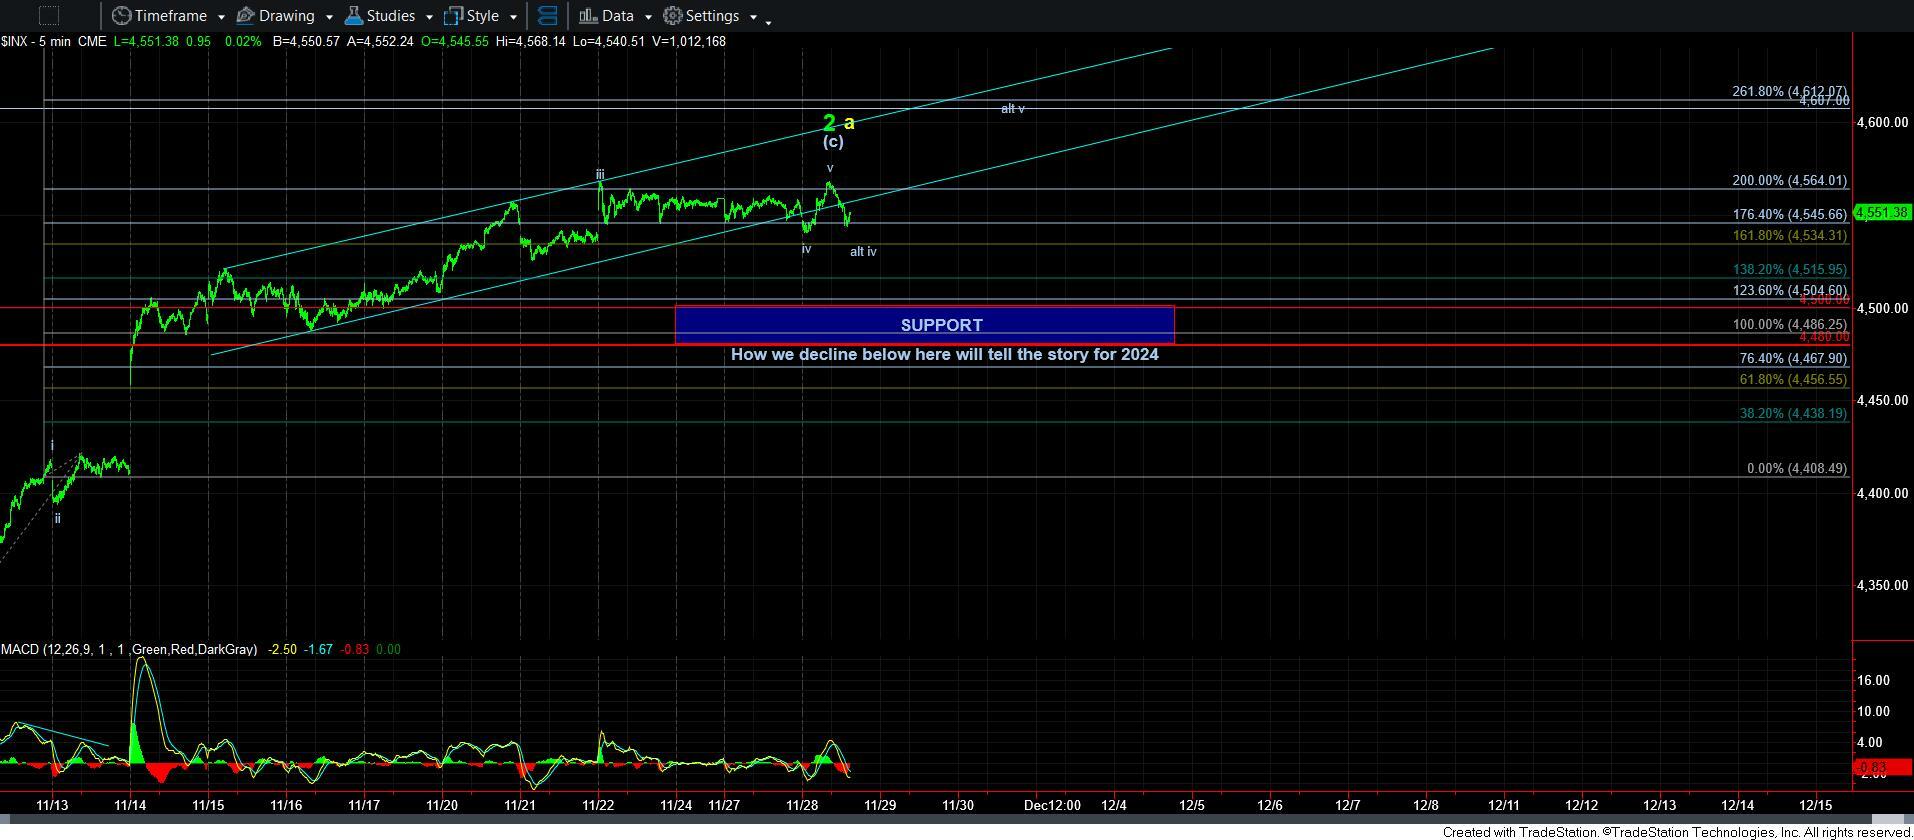
When I take apart today’s rally, I really view it best counted as only a three wave structure. Therefore, it may only be a b-wave in the micro wave iv. For this reason, I have noted an alt iv on the chart, with today’s high representing a b-wave within that wave iv.
So, I will add that a break down below 4534SPX would be an initial indication that the [c] wave has completed. But, I still want to see a break down below the support noted on the chart to confirm that the [c] wave rally has complete. We can then analyze the structure of the decline in order to determine if it is the green or yellow count.