Market Is Not Making This Easy
 By
Avi Gilburt
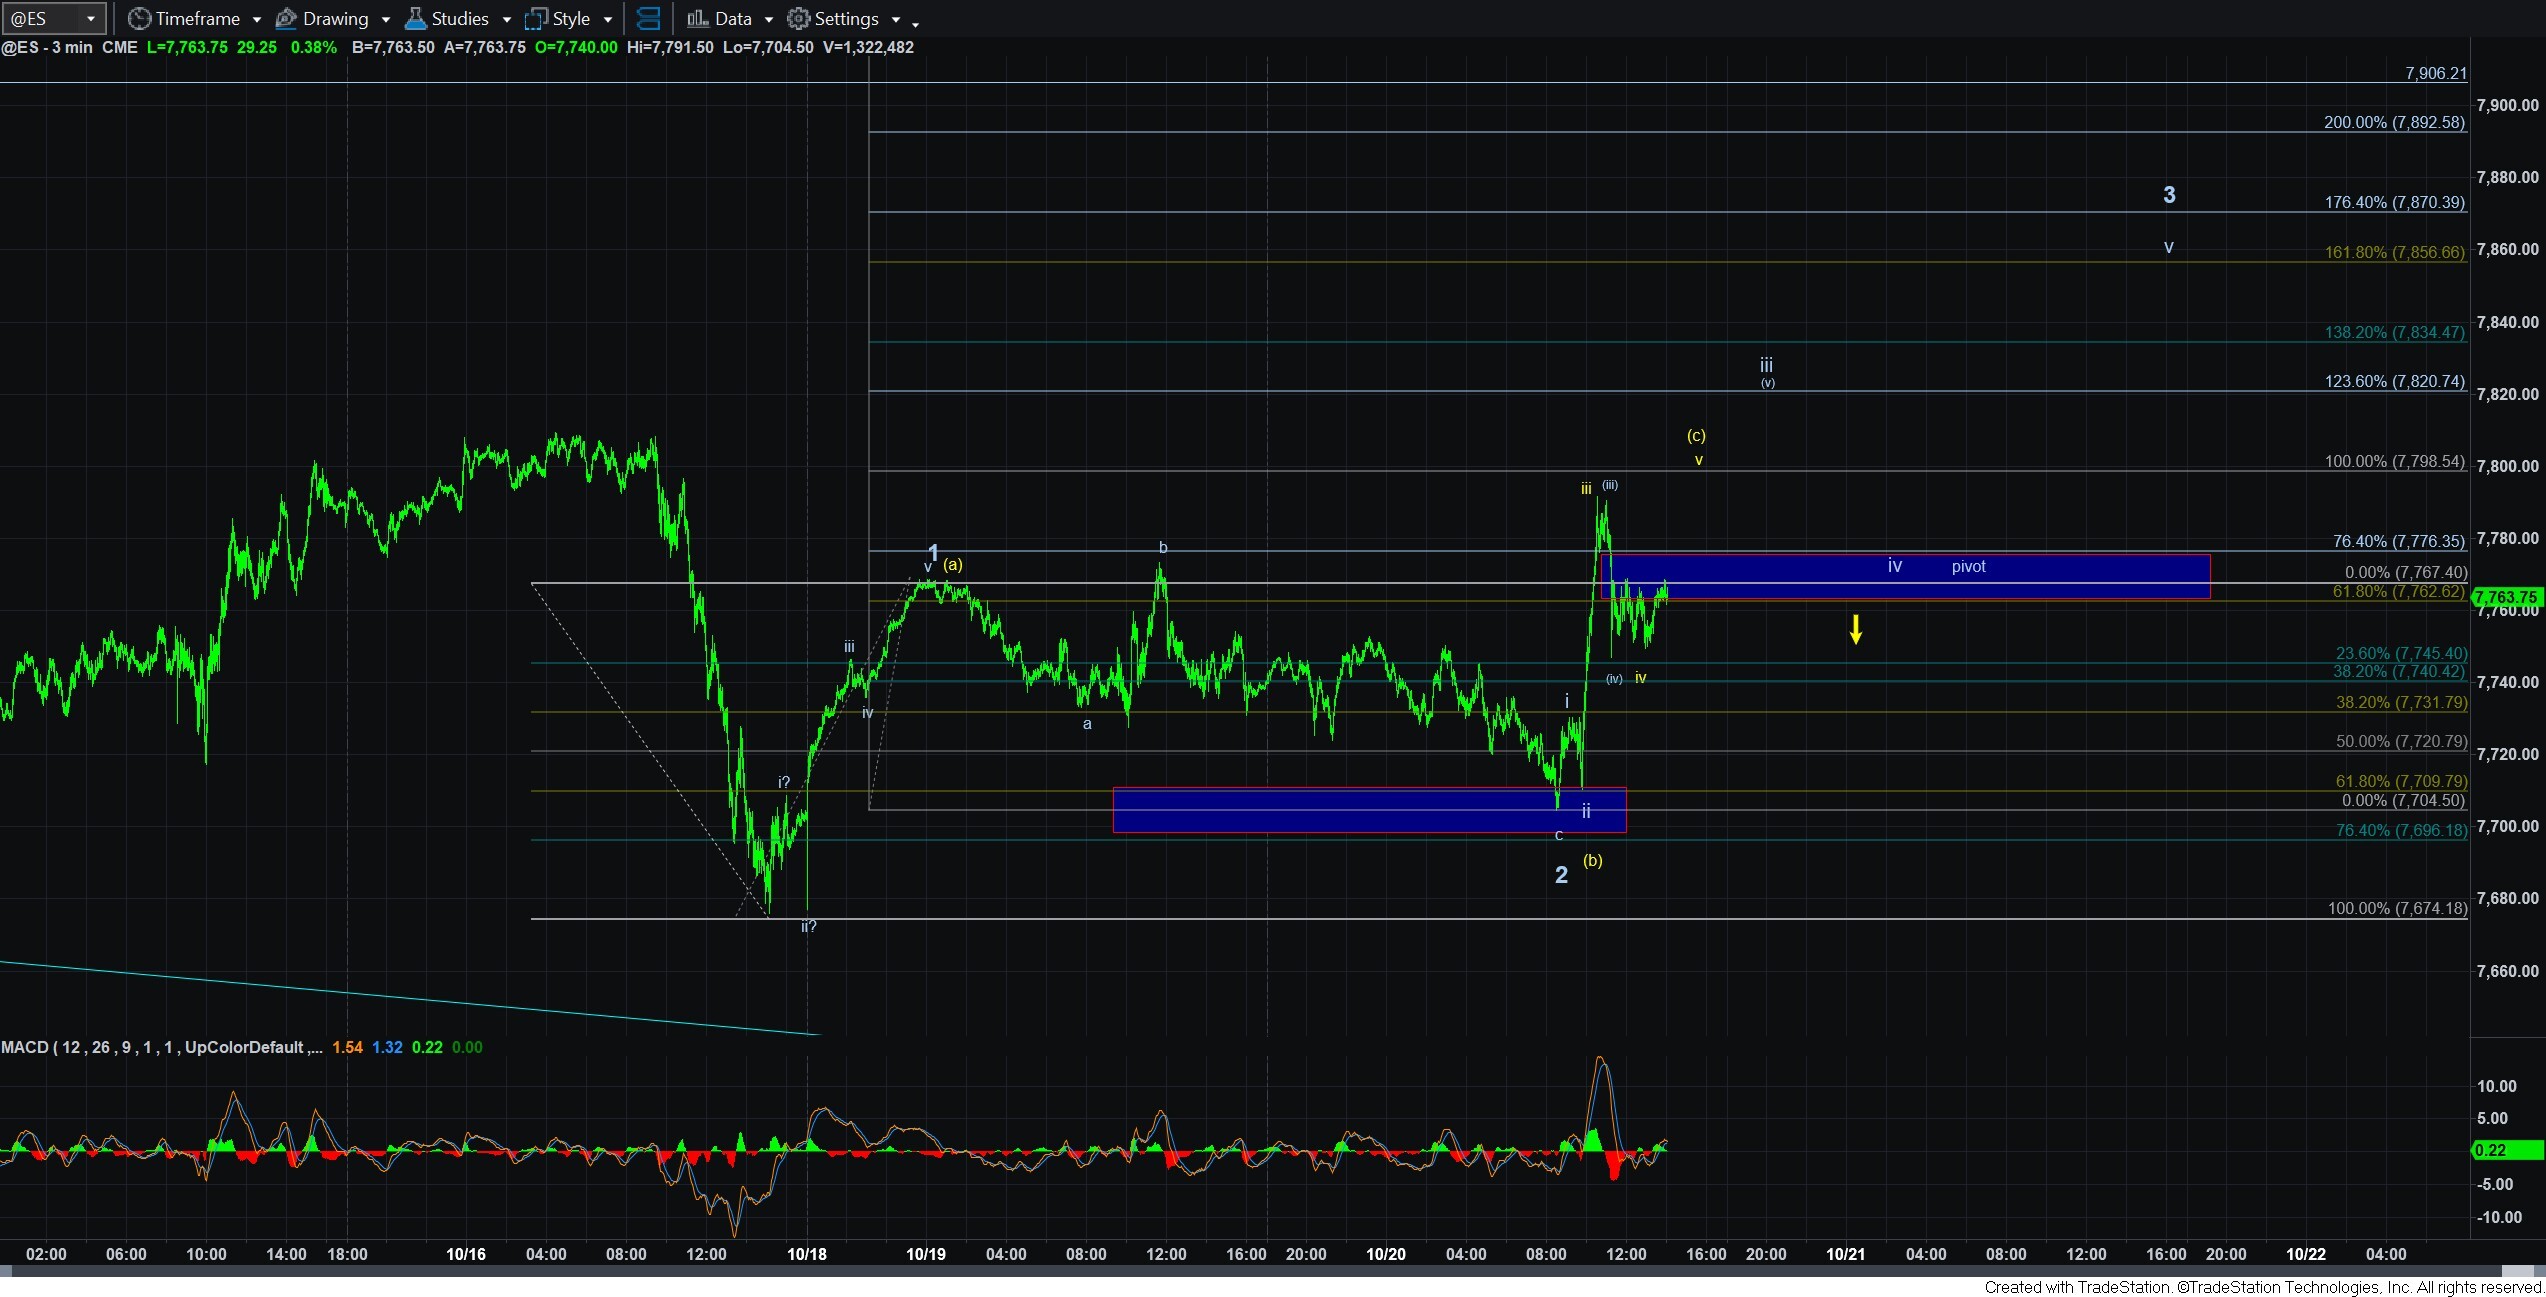
While the market did drop to the support box I outlined as my preference in yesterday’s update, and we did rally off that as a 3rd wave normally would, we stopped short of the minimum target for a wave iii of 3, which has added some complexity to the region within which we now find ourselves.
So, I was debating whether I should wait until the end of the day to do the update. But, I decided I am going to lay out the paths before the end of the day, and that is what the rest of this update presents.
Let’s start with the yellow count. In that structure, the market would normally rally off the (b) wave low from this morning, and strike the 1.00 extension wherein (a)=(c) and then turn down in impulsive fashion and break below the pivot to begin the c-wave down.
However, the market came up short of the (a)=(c) target, and then turned down in what counts best as a 3-wave structure thus far. Therefore, I cannot say that I have strong support for the yellow count at this time. In fact, if you look at the yellow micro-count I have noted on the 3-minute ES chart, we still can move higher one more time to the 1.00 extension to complete a 5th wave in the yellow (c) wave if we do not complete 5 waves down first.
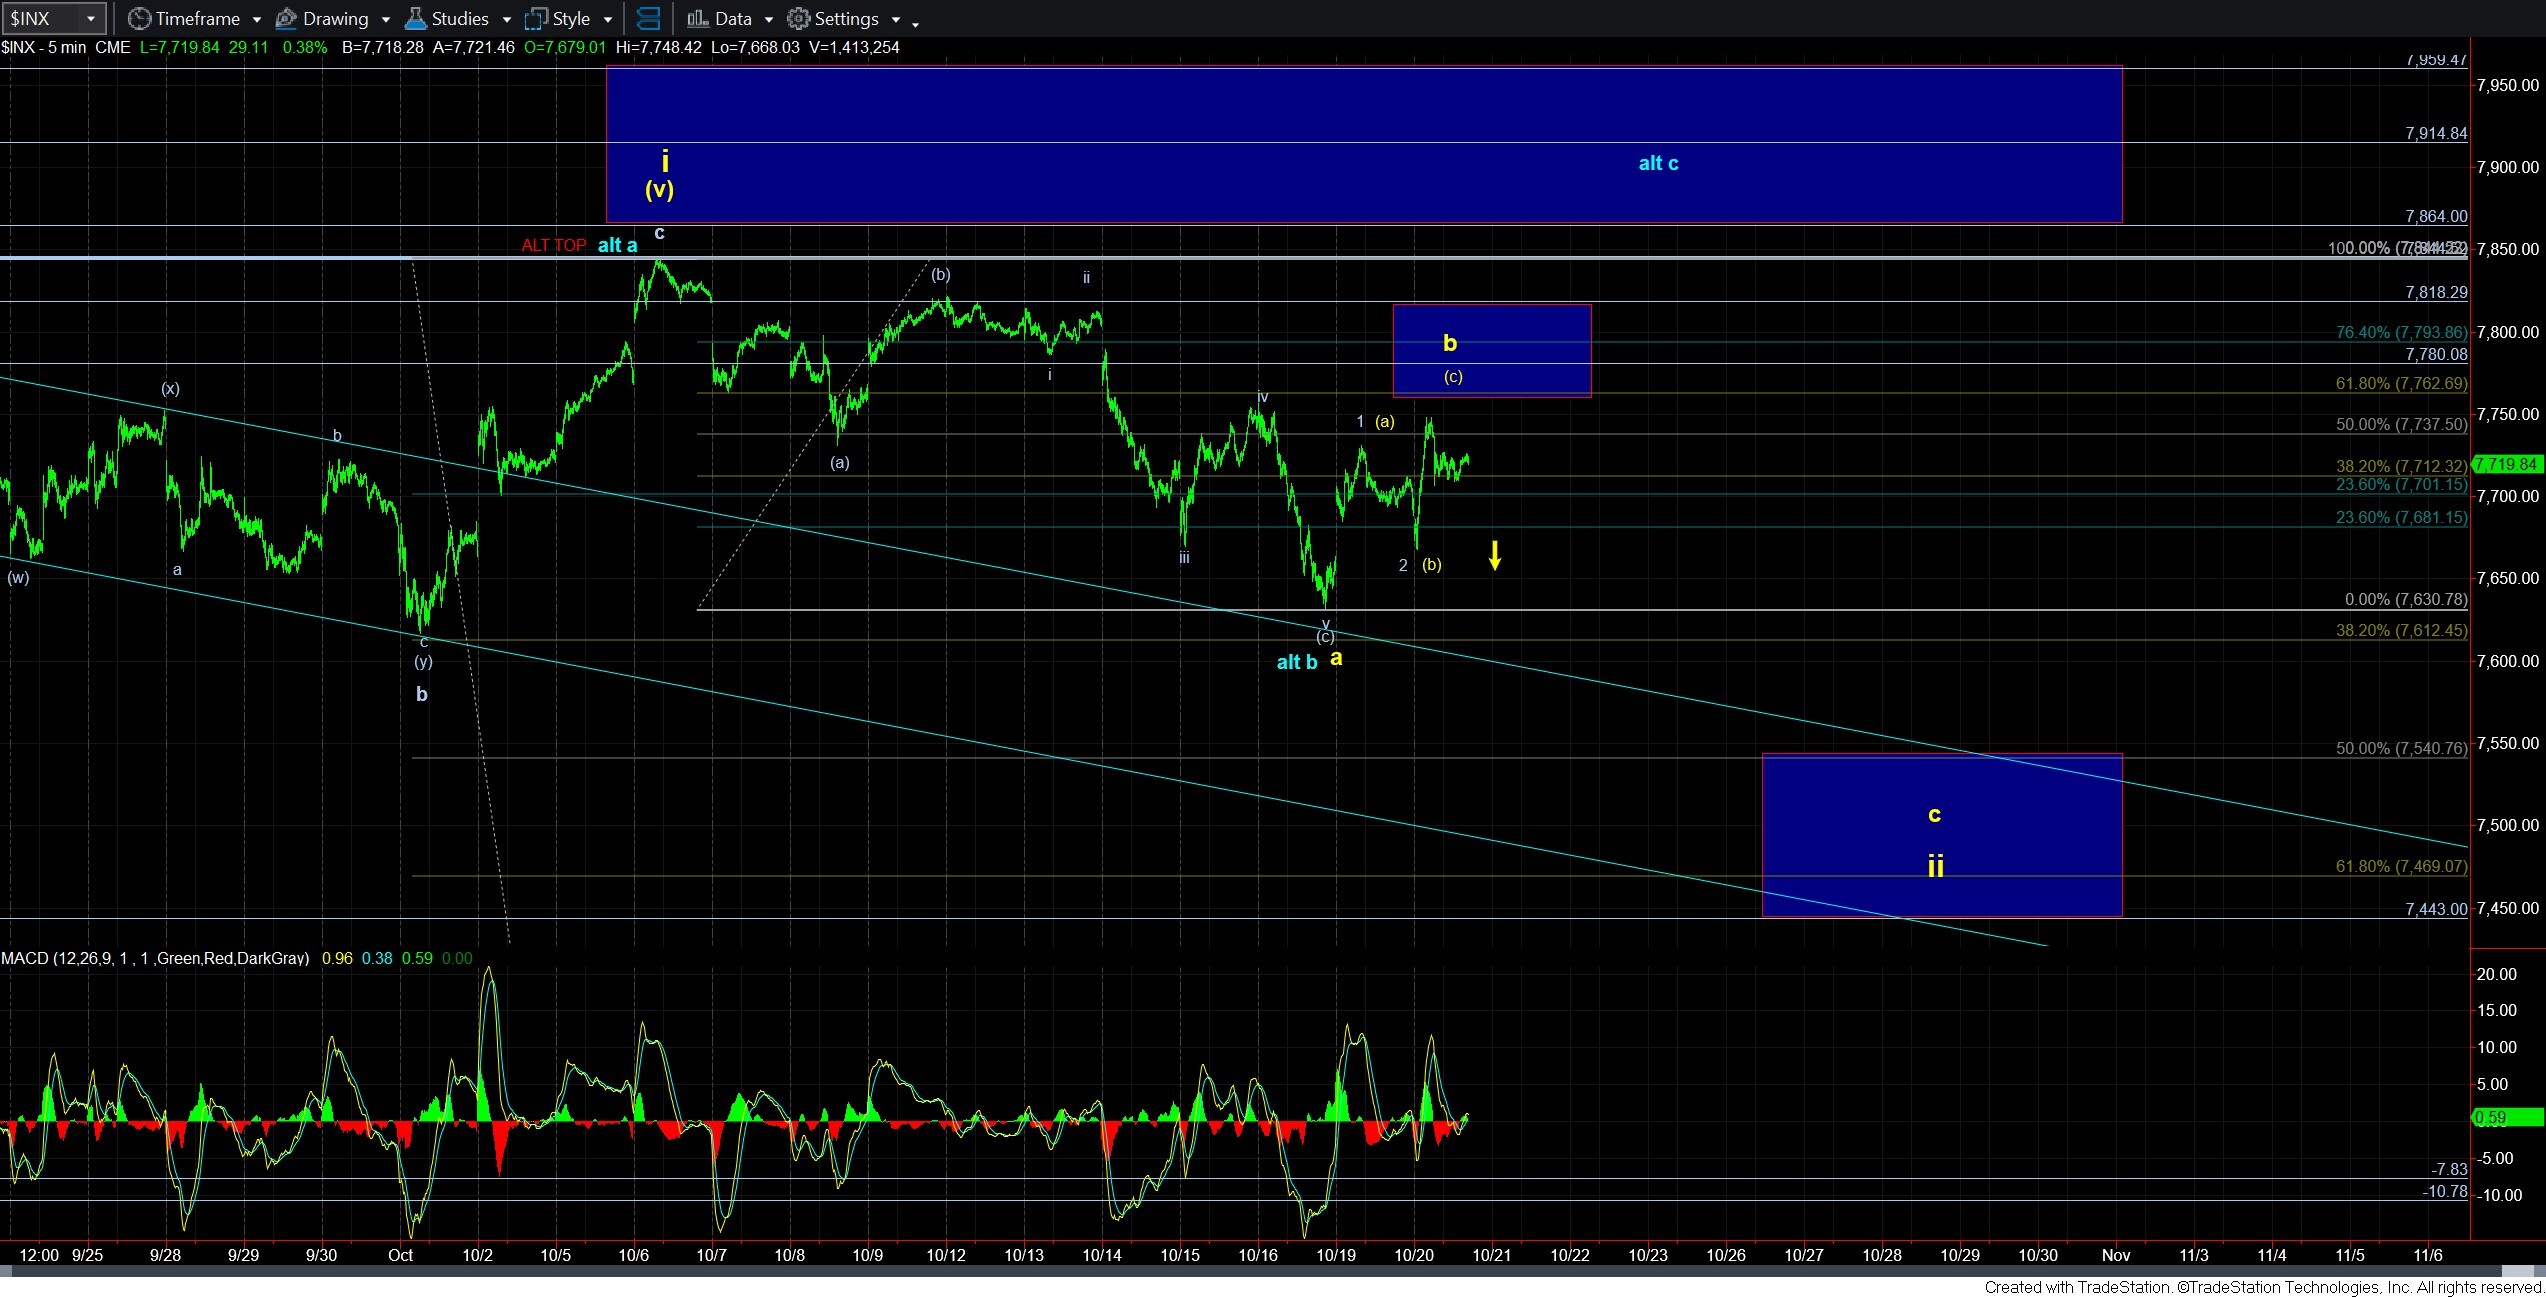
At this time, what would make the yellow count rather clear is if we break below the low struck today. That would make it likely that the yellow c-wave down is likely pointing us down to the lower support/target box noted on the 5-minute SPX chart.
Now, without a 5-wave decline, it still leaves the door open for the blue count. But, needless to say, this is also less than ideal. Normally, we want to see the market strike AT LEAST the 1.00 extension for wave iii of 3, pullback correctively to the .618-.764 extensions of waves 1-2 (which we outline as our pivot), and then continue higher to the 1.618 extension for wave v of 3. Yet, we came up short of the wave iii minimum target. So, in the bullish count, I have to assume that wave iii has not yet completed and the high today was likely wave (iii) of iii of 3, and the pullback was wave (iv) of iii of 3. I have outlined this count on the 3-minute ES chart as well.
Of course, both sides may also morph into diagonals. But, I just do not have enough information to outline that potential with any reasonable probability.
So, where does that leave us?
The simplest way to look at this market is by using today’s low. As long as we hold over today’s low without seeing any CLEAR impulsive declines, then I have to assume there is some unfinished business overhead, as per the blue count.
However, should we see a CLEAR impulsive 5-wave decline or should we break down below today’s low, that will significantly increase the probability for the c-wave decline progressing towards the support/target box below on the 5-minute SPX chart.