Market Is Not Giving An Inch
With the continued push higher today, I have now made the ending diagonal count my primary count, but I cannot say that with high confidence, and I will explain why below.
As I have noted time and again, shorting is never advisable during bull markets because surprises always come to the upside, and the market likely still has a date with the 2600SPX region. But, I still think we will see a bigger pullback before that rally to 2600SPX begins in earnest.
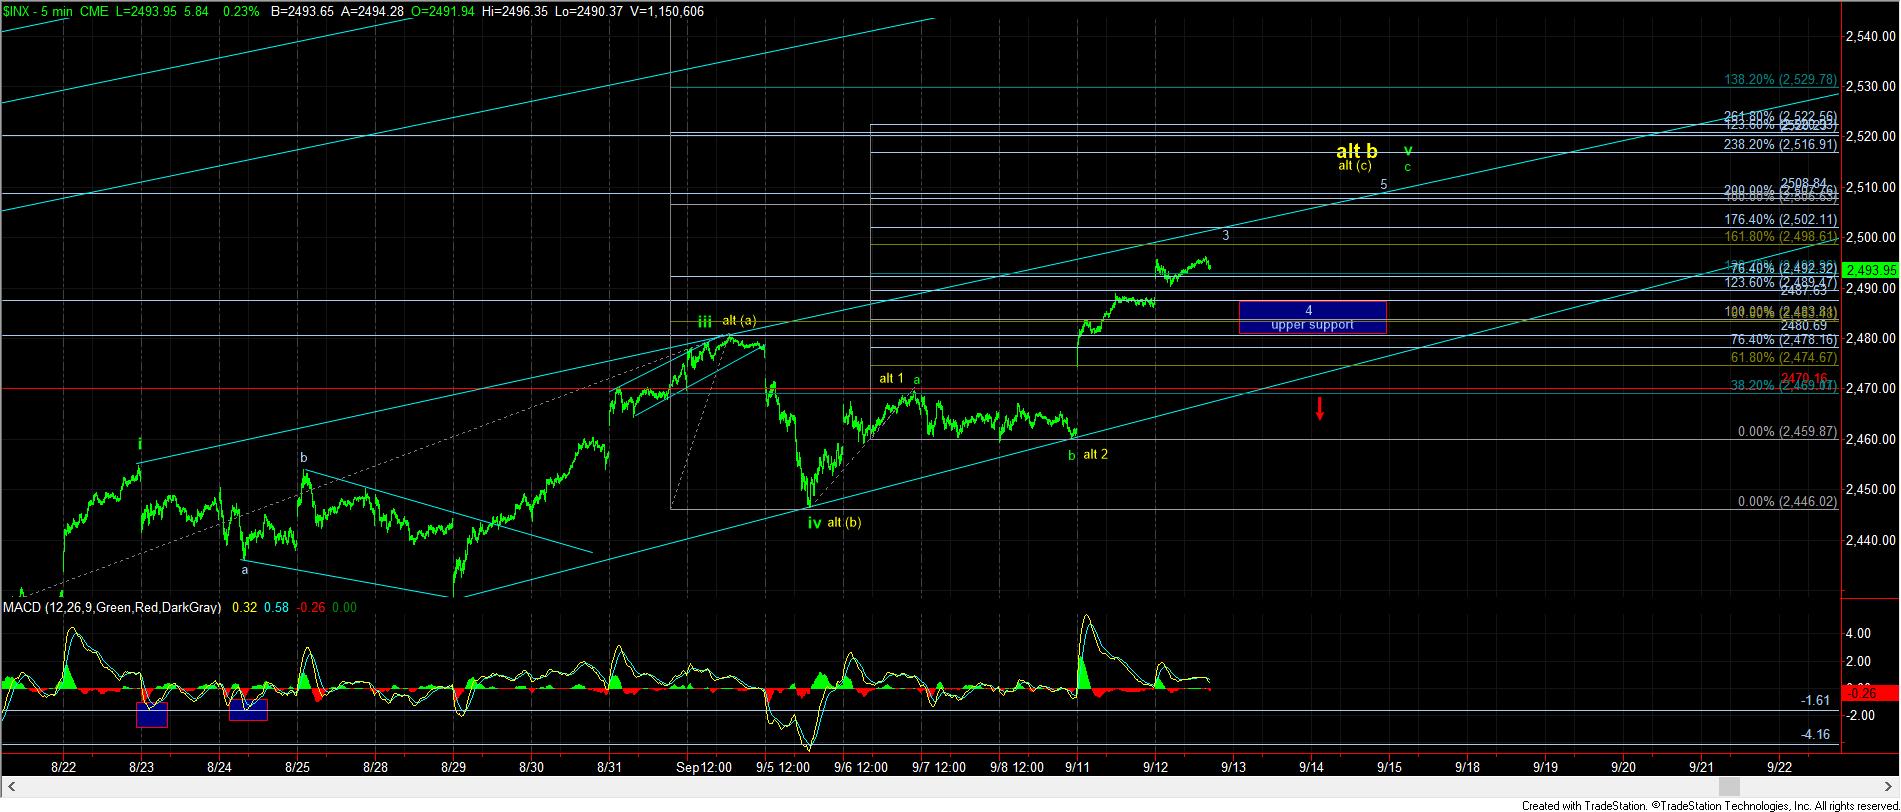
The rally off the August lows has been overlapping, which usually means that we are dealing with an ending diagonal. Of course, it can be a series of 1’s and 2’s, but we would need to see the market blow through the 2510SPX region this week for me to even consider that potential. Until such time, I am viewing this overlapping structure as an ending diagonal.
Support now resides between 2480-2487SPX. As long as that support is held, I am still looking at a test of the 2500-2510SPX region next. It would take a strong break of 2480SPX, with follow through below 2470SPX to signal that the ending diagonal has completed, and we are likely heading back down to the 2420SPX region.
One of the results of the completion of an ending diagonal is that the market reverses quite strongly back down to the region from which the ending diagonal began. And, in our case, that is the 2420SPX region.
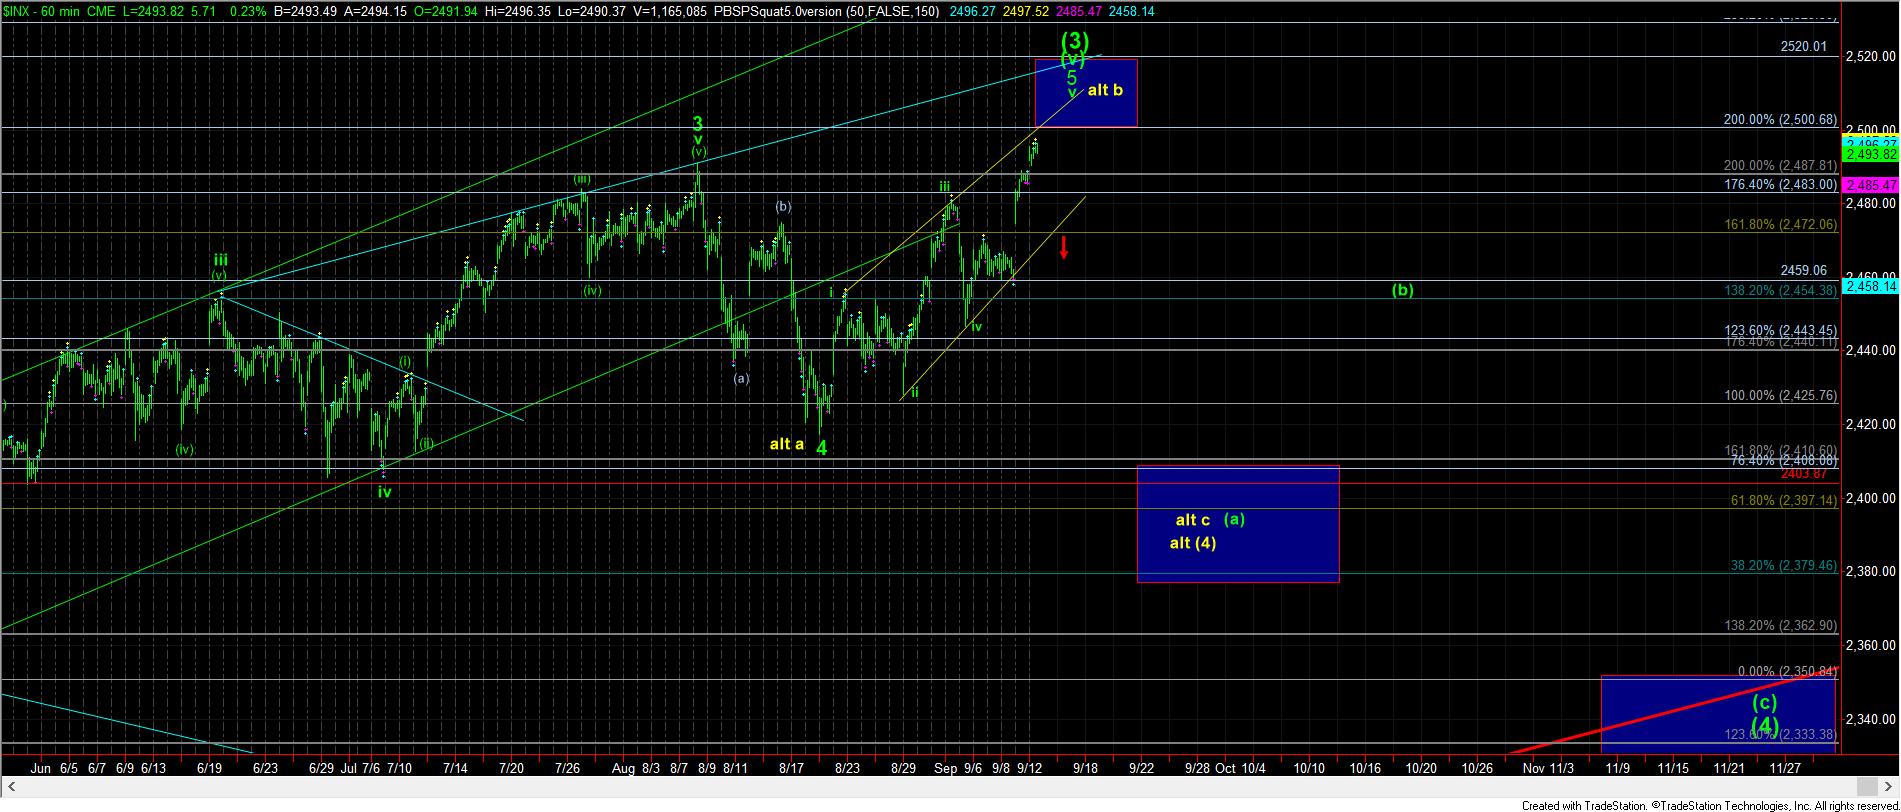
However, the more and more I pick apart the move up off the August lows, the more and more I like the b-wave rally count. You see, the move up off the August lows does not seem to be a standard impulsive structure, as I noted above. Moreover, if the market turns down hard from the 2502-2507SPX region, it would provide us with an (a)=(c) rally, wherein the (c) wave would provide us with a full 5 wave structure into the 1.76-2.00 extension region for that (c) wave rally, which is the standard target for a 5 wave move based upon Fibonacci Pinball. That would be strong confluence for a top in my humble opinion, but we need to see a strong reaction off that region to the downside. I have added the micro count in yellow as to how I see the b-wave pattern, with the 3,4,5 applicable to both counts at this time, as long as we hold over 2480SPX.
So, should the market top out between 2502-2507SPX, and turn down hard, I will be on the lookout for a 5-wave c-wave structure down to the 2400SPX region (which may even feel “crash-like). Should that be what plays out, then be prepared for me to tell you that there is potential for ALL of wave (4) to be complete with that type of action. While I would still prefer that to only be an (a) wave of wave (4), the ensuing rally off that low will tell the entire story. But, I would strongly consider buying stocks with the thought of looking to 2600SPX should that scenario play out. I do not want to be left behind for that rally to 2600SPX.
So, you may want to prepare your shopping list, as I am still not convinced that the market is heading up to 2600SPX just yet, and am still looking for a pullback over the next few weeks.