Market Is At Another Inflection Point
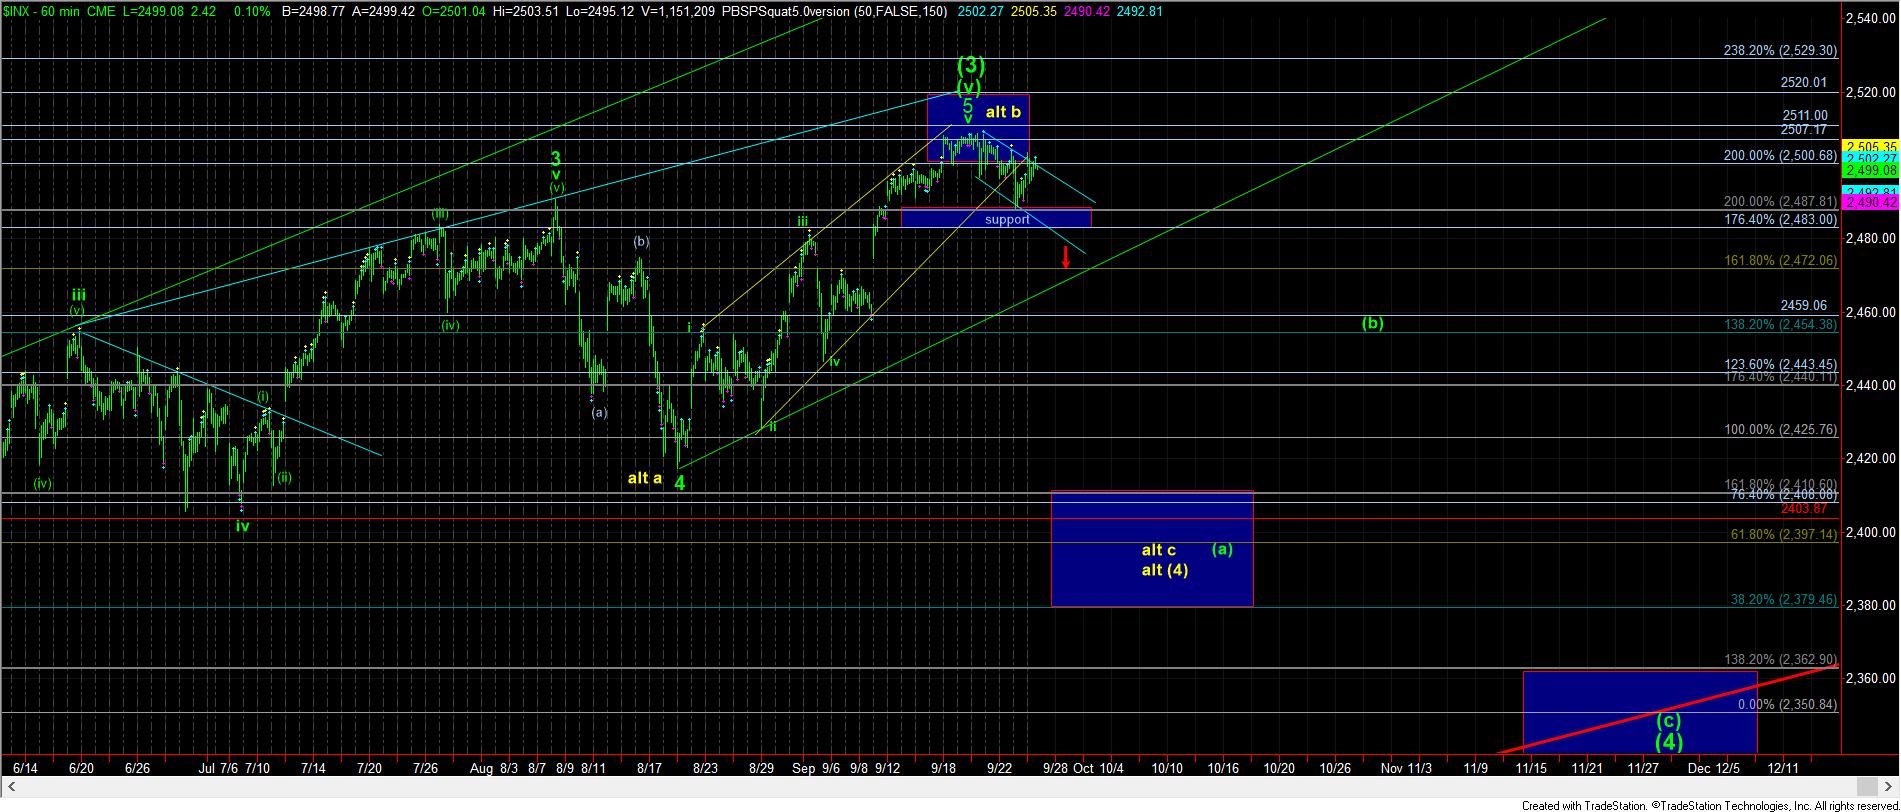
With the market holding support yesterday, we have no signal that a b-wave has topped. In fact, the bulls still retain control as long as we do not break back below yesterday’s low. And, their control can be pointing towards the 2520-30SPX region, as we have discussed.
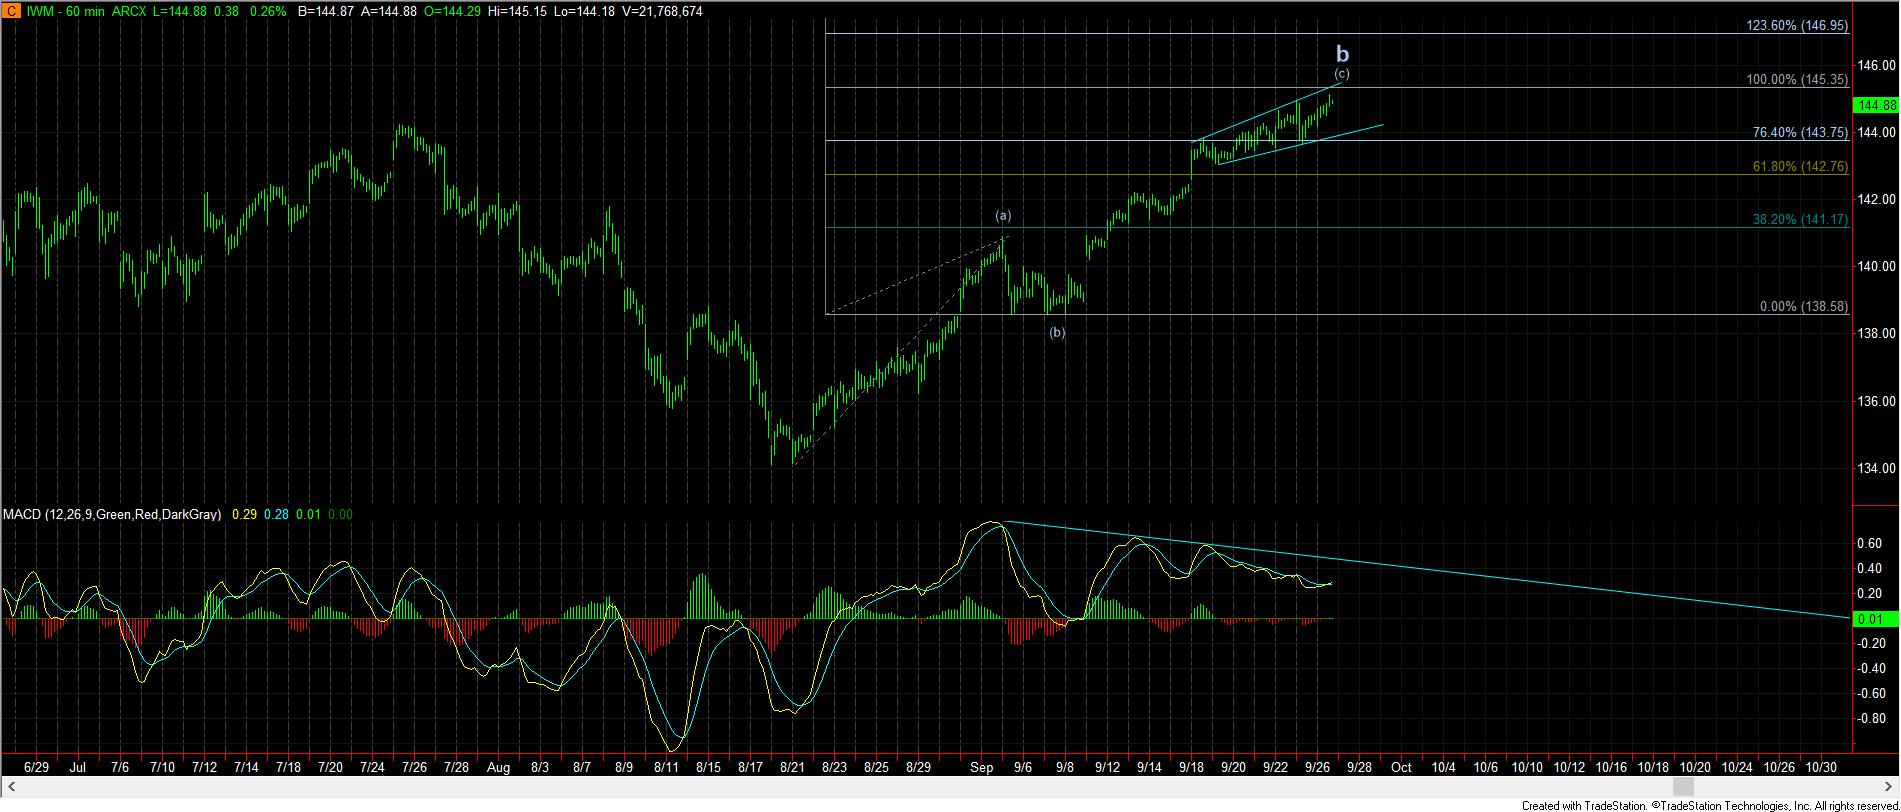
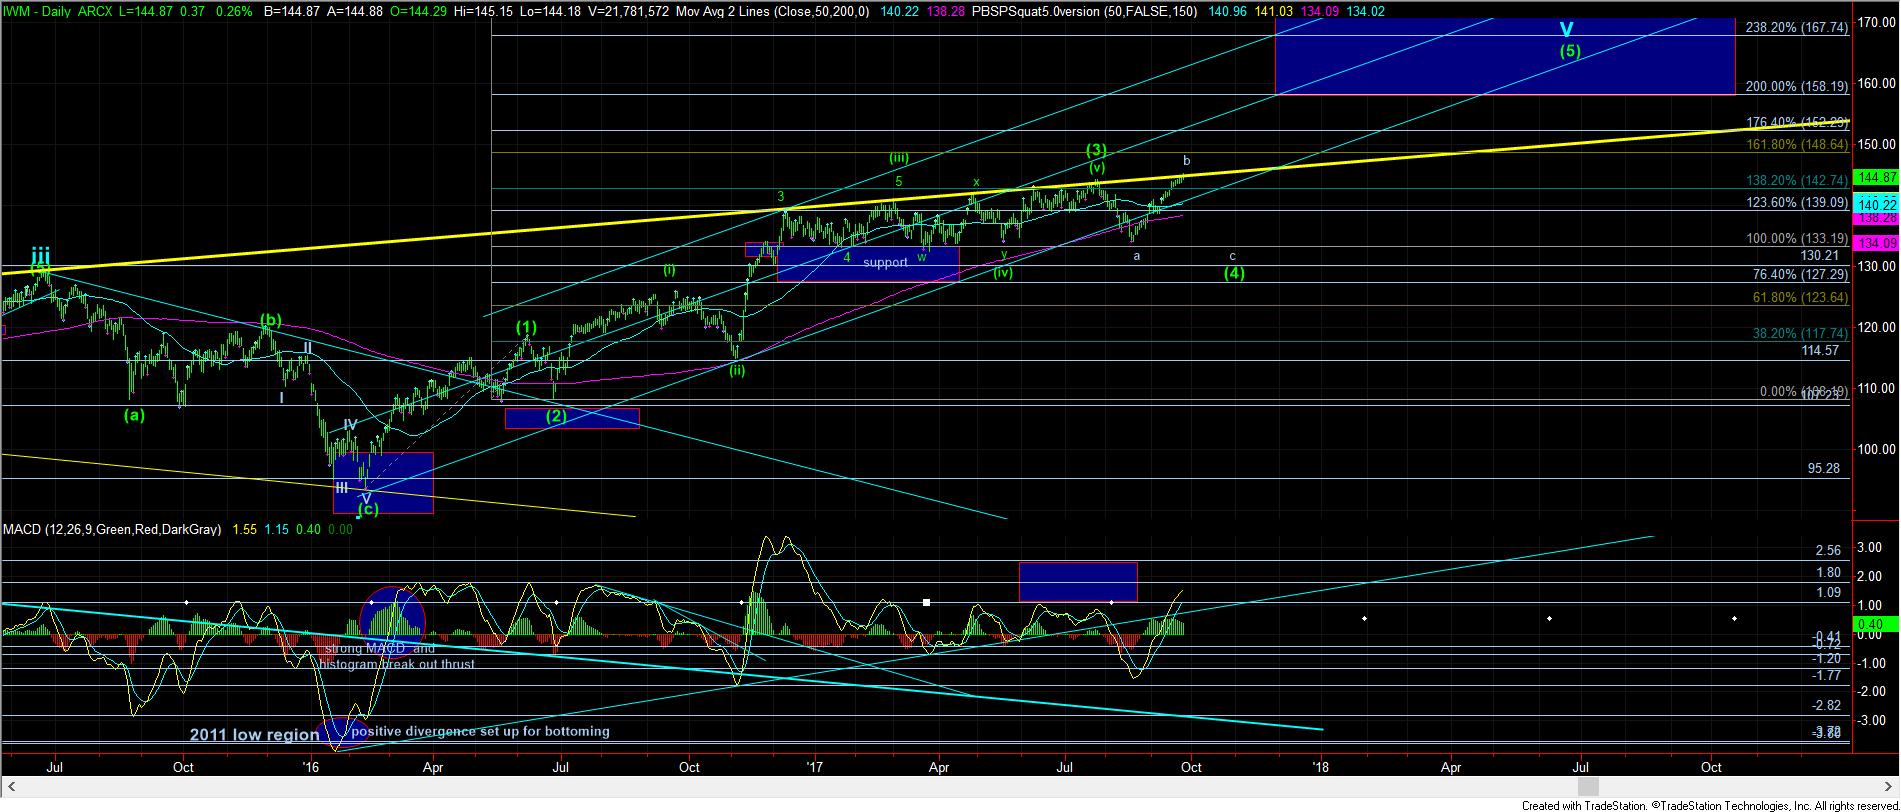
However, the more work I have done on the IWM, the more it shows me that there is a potential turning point here. As you can see from the attached charts, the wave structures really count best as this being a b-wave rally in a larger degree wave (4), which also happens to be my preference in the SPX. Currently, the market is testing the point where (a)=(c) for the b-wave, as shown on the 60 minute chart.
Moreover, you can see from the daily chart we are at a long term trend line overhead, which has kept this market in check for years. But, in order to confirm a b-wave top, we need to stay below the 145.35 region, and then break down below the 142.75 region. That would have us pointing down back towards the 133 region in a c-wave of wave (4). But, again, I must stress that this region must hold as resistance, or we can see a further break out towards much higher levels.
In the SPX, we have had to deal with overlapping wave structures for the better part of the last 2 weeks. Unfortunately, that does not provide us a confident wave count, as impulsive structures are much more reliable for market signals. But, we have to play the cards we are dealt, so allow me to present the lay of the land again.
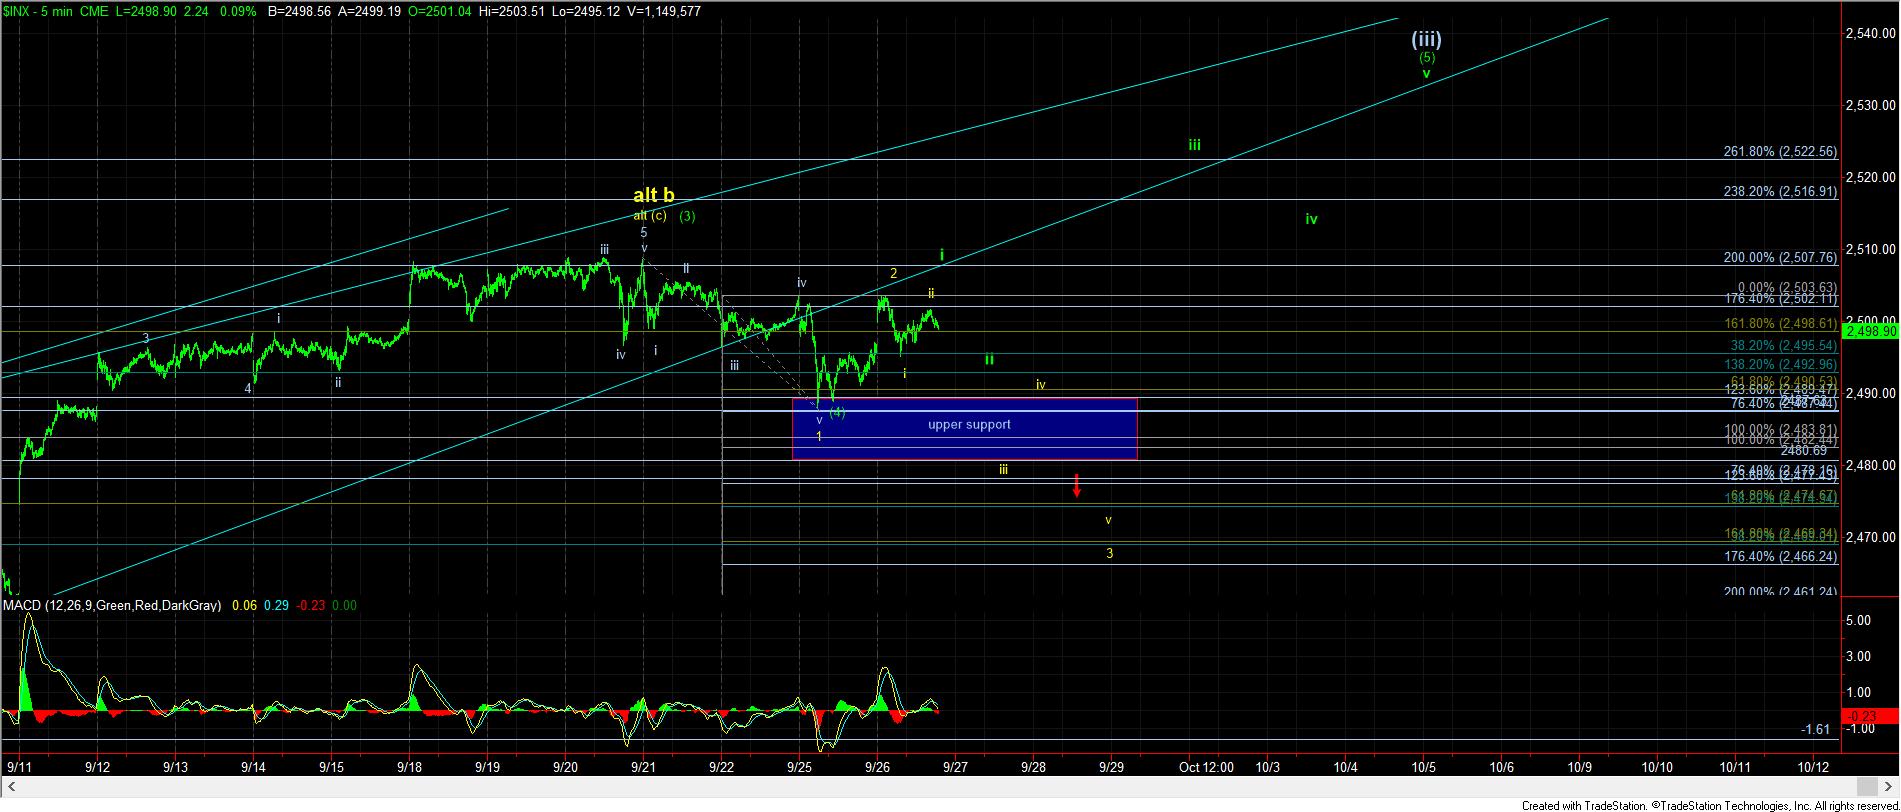
I have modified our 5 minute chart to show the potential we have in the current region. As long as the 2489SPX level is held, the bulls have the ball, and are trying to run towards the next target region in the 2520-30SPX region for the grey wave (iii). Yet, in order to make that potential much stronger, we still need 5 waves up off yesterday’s low. Thus far, the best I can come up with in the cash index is only 3 waves. We would need a higher high over today’s high to make it a cleaner 5 waves up for wave i of wave (5) of grey wave (iii). So, again, as long as the bulls keep the market over 2489SPX, they retain the ball and are going to try to drive to 2520-30SPX.
Should we see the market break down below 2489SPX, it opens the door to a test of the 2480SPX region, and then 2491SPX becomes important resistance. If the market does drop to 2480SPX, and is unable to recover back over 2491SPX, that will potentially trigger a drop to at least the 2460SPX region.
So, again, we are another point of inflection. As long as the bulls keep the market over 2489SPX, they remain in control. If the bears can take out that level, we have a proverbial “fumble,” and the 2480 and 2491SPX region will decide who comes up with the ball.


