Market Holds Support And Moves Sharply Higher
 By
By
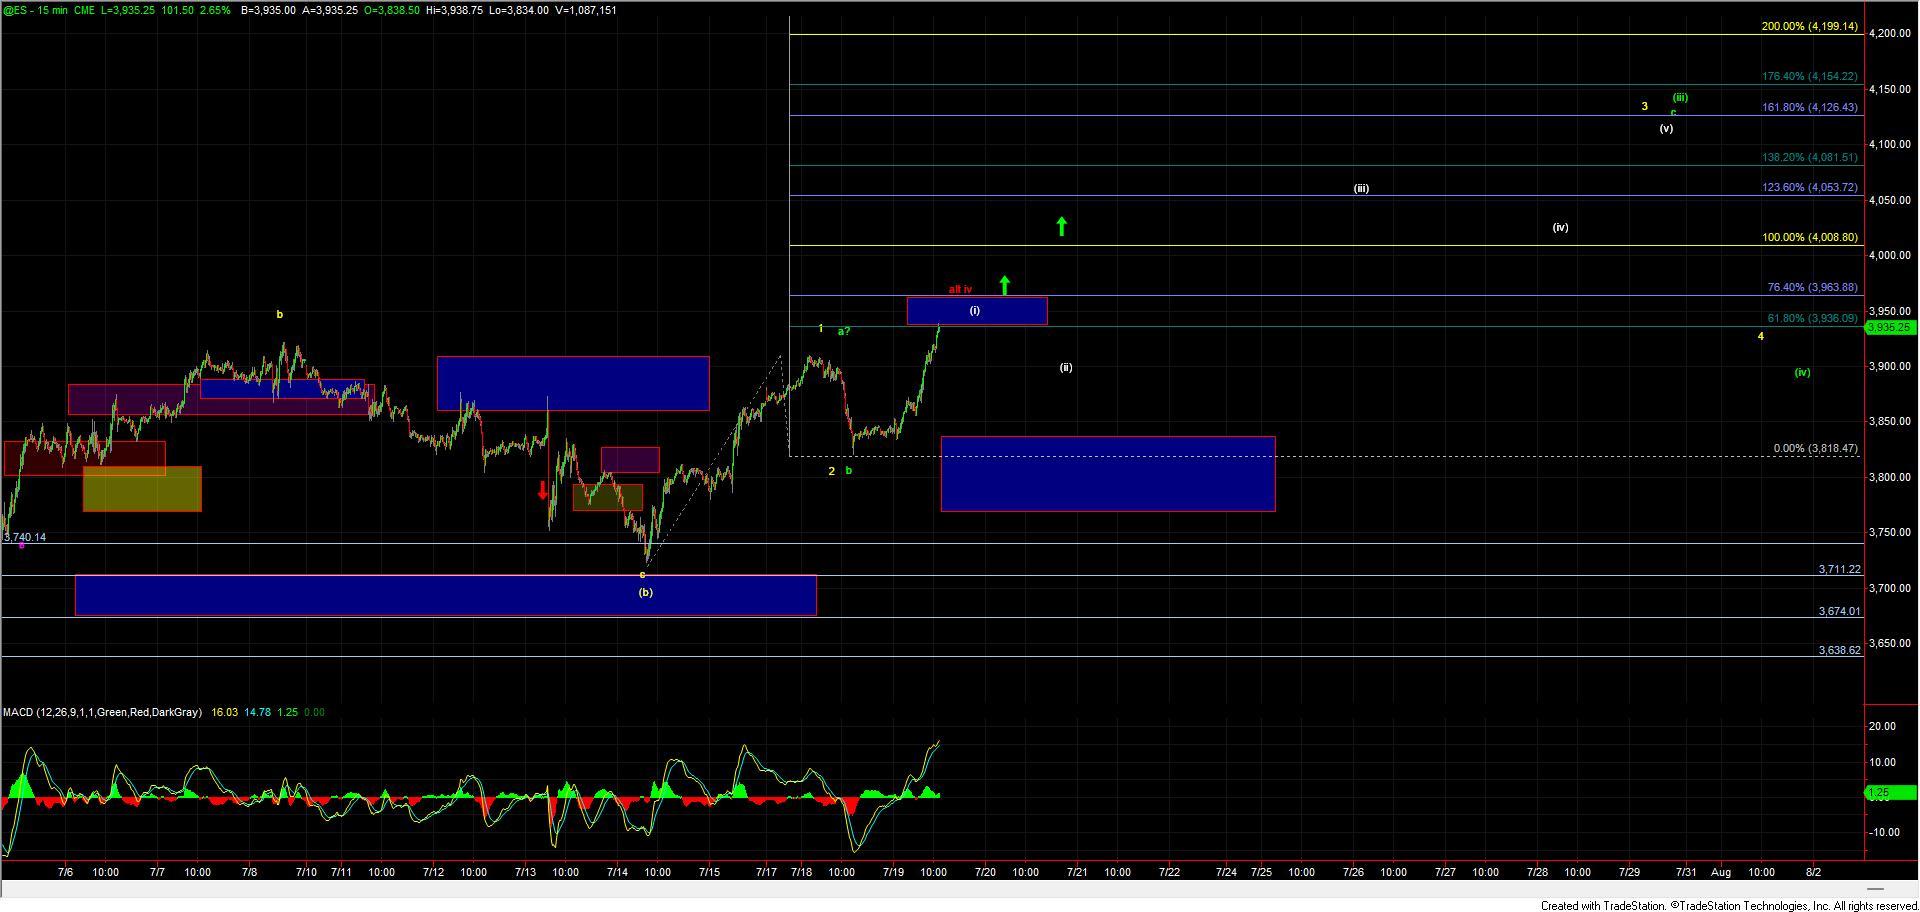
After finding the local top in what we had been counting as the top of a wave 1/a yesterday and moving lower into the upper end of support for the wave 2/b today the market ripped higher up over 2.5% at the time of this writing. So with that, this is following the path that we had laid out and expected fairly well over the past several days and we are following a fairly clean fib pinball pattern into today's high. We are currently testing the next key pivot zone which may provide a bit of resistance and/or a minor pullback before continuing directly higher but as long as this can continue to hold the support levels I will outline below the pressure will remain up on this and we should be well on our way to that 4100 target region that Avi had laid out in his weekend update.
Yellow Count
The yellow count would now signal that we have begun the wave 3 up as part of a larger wave a within a larger ABC structure. We should be approaching the next key pivot zone at the 3936-3963 zone at which point a small pullback/retracement would be expected. This pullback should hold over the 3863-3846 zone with the upper end of that zone being the ideal spot to hold in what should be a nested 1-2 pattern up off of the lows. We should then see a break through the pivot zone and then a move through the 4008 level which represents the 100ext of the initial move up off of the lows after which we should have a fairly clear shot up towards the 4081-4126 zone for the wave 3. It will be at this point in which the count will likey get more challenging and at which point it will likey make the decision as to whether it is going to follow the yellow or the green paths and once we get there we can better layout the parameters to help give guidance as to which of these paths will become more likely.
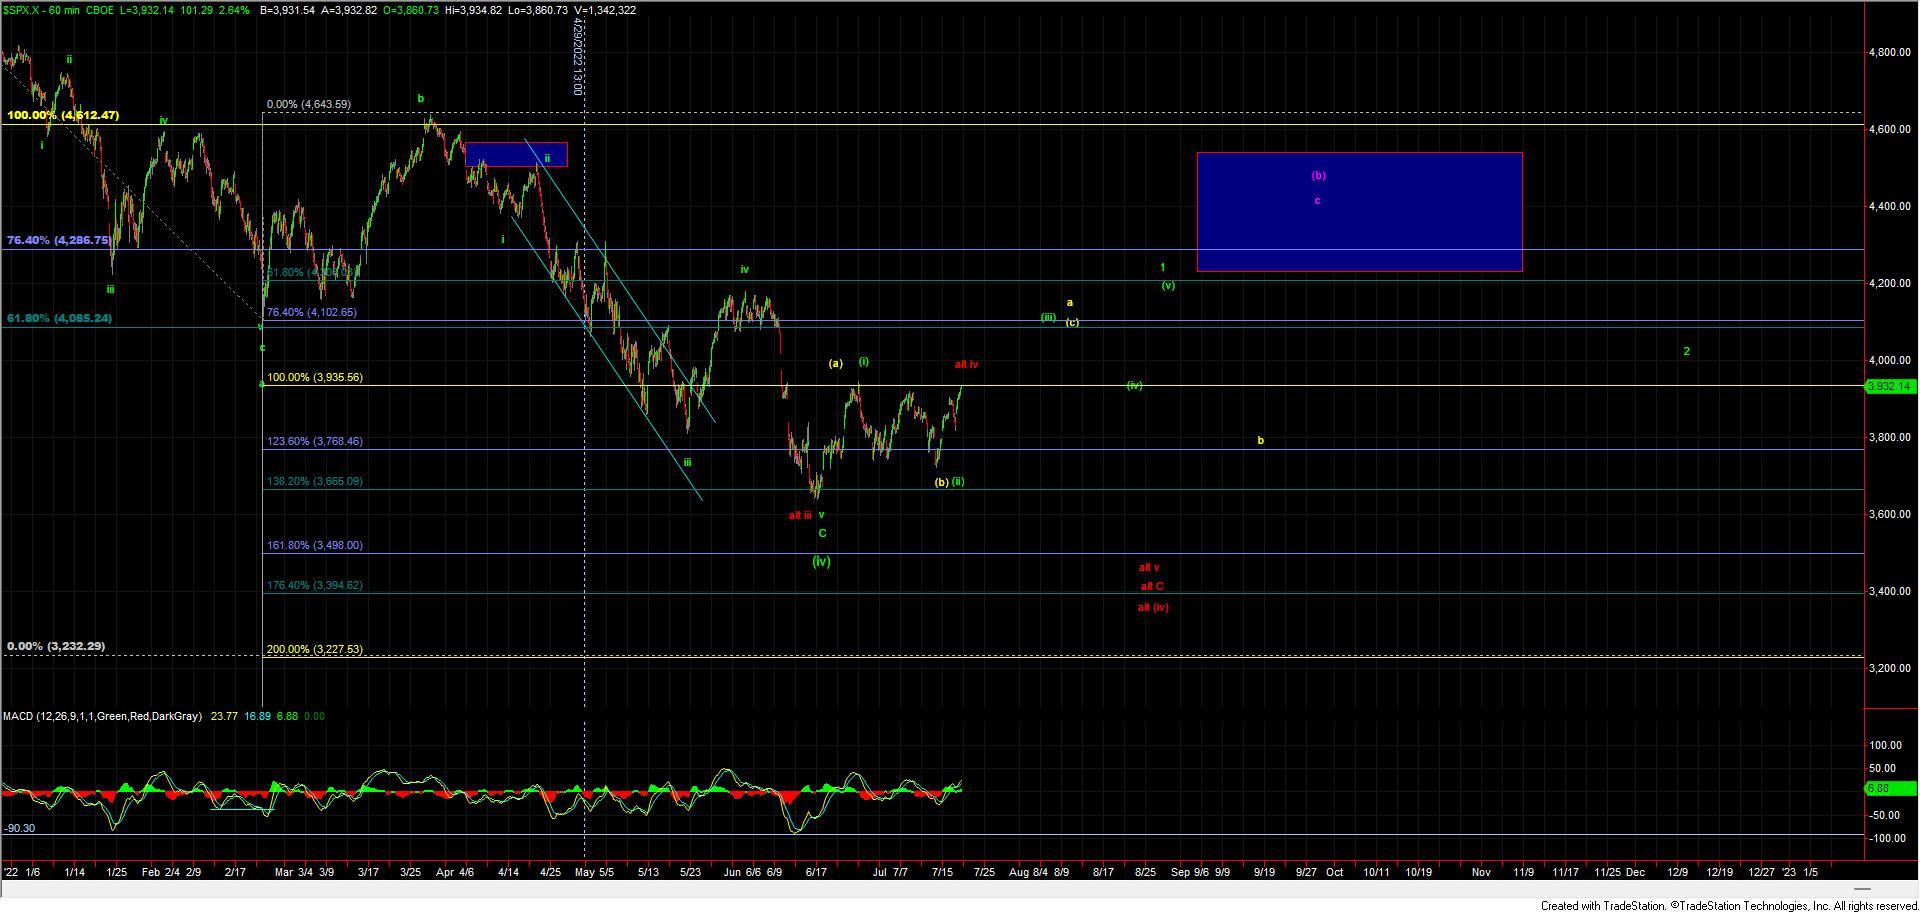
Green Count
The green count is almost identical to the yellow count at this point in time and as I noted above we really wont know which path we are following until we top out near the 4081-4126 zone overhead. Again I will layout the parameters if and when we get to that zone.
Red Count
The red path as previously laid out is now invalidated but I have now changed this potential path to the same count that Avi had laid out in his weekend update. I am not viewing this path as highly probable at this point in time but will leave it on the charts for the time being. I would need to see a break back under the 3816 level to suggest that we may have topped in this red count and unless and until that occurs the near-term pressure will remain up per the yellow/green counts as described above.
Today's action has given us the next level of confirmation that we are indeed heading higher at least towards the 4100 region. If and when we do reach that zone this is when things will likely get a bit more challenging from a wave count perspective. For now however as long as we hold over the support levels noted above the pressure will remain up and this seems to be following a fairly clean fib pinball pattern which is giving us very good parameters to work with thus increasing the reliability of the wave counts.