Market Hitting Its Head Against Resistance But Still Has Yet To Break Support
 By
By
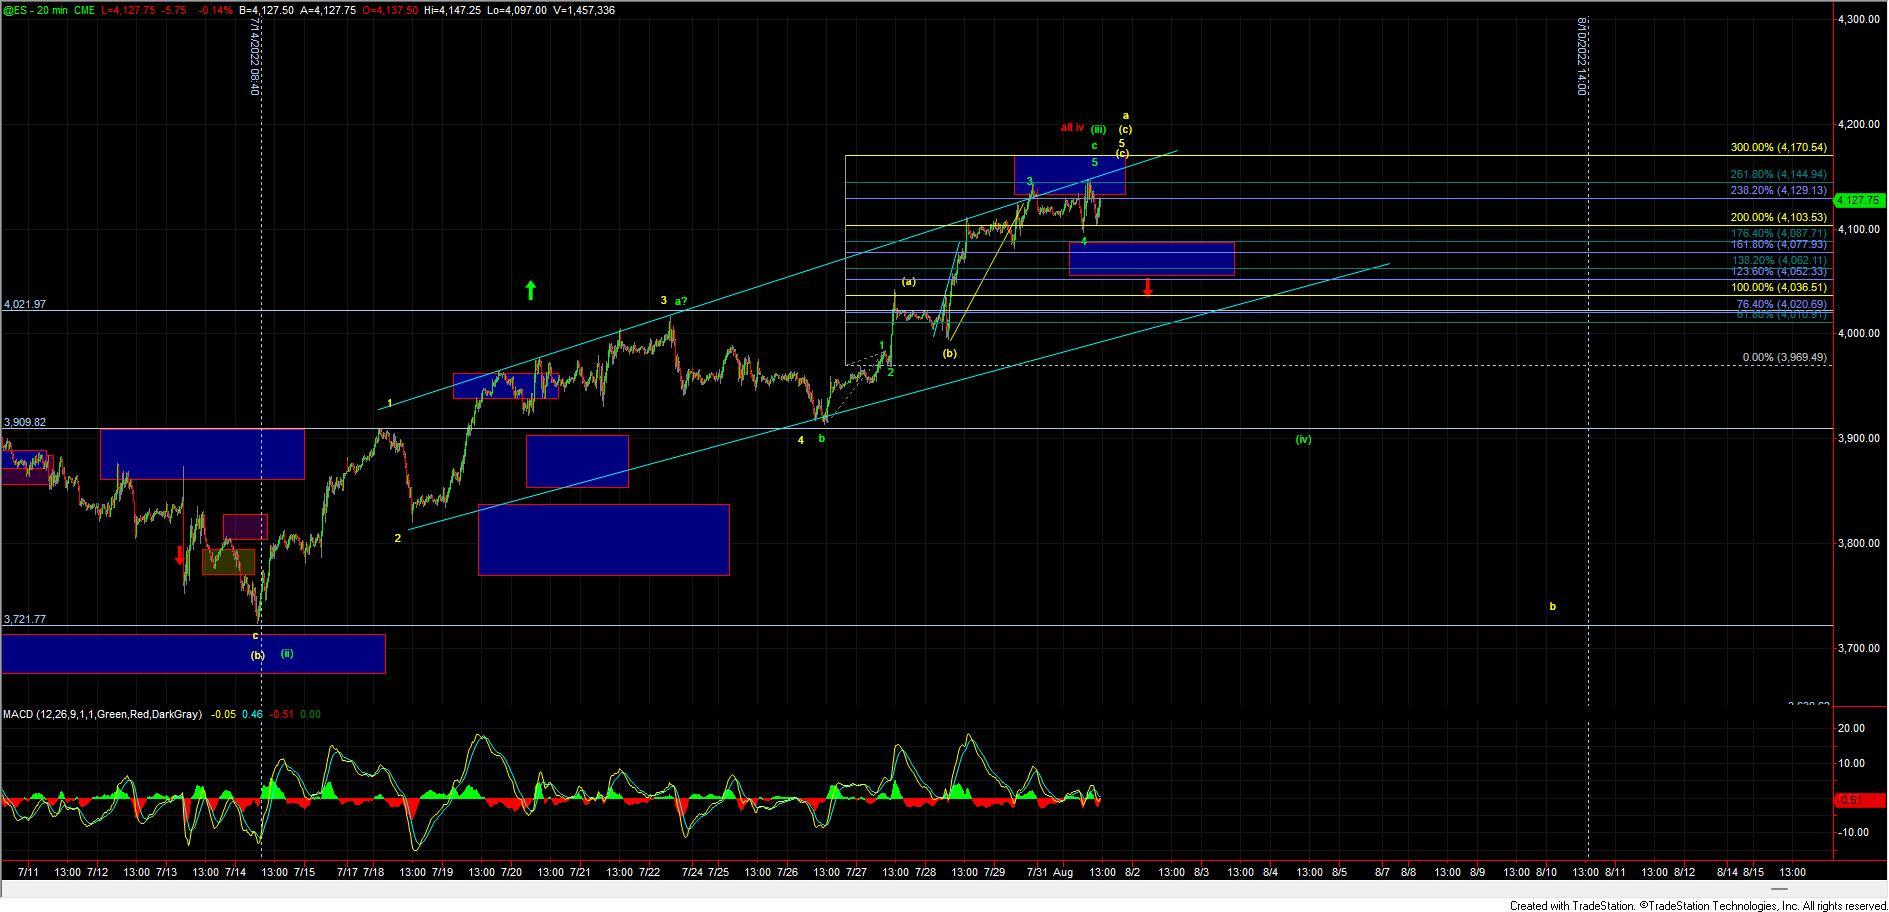
Today the market opened slightly lower, but then pushed to new highs fairly early in the trading session, moving up into the 261.8 ext on the ES, which came in at the 4144 level. That level held, and we saw a fairly decent rejection right at that fib, which saw the market turn back lower into the final hour of trading.
The action down off of that high is, however, so far corrective in nature, and we are still sitting well over even the upper support level. So, while the market is oversold at these levels on multiple timeframes and does have a potentially full pattern into today's high, until we see a break down below the upper support zone at the 4087-4052 zone we simply do not have confirmation of a top just yet.
I do, however, want to note that I am beginning to see some early indications over in the VOL space that the market is likely ready to see a pullback, and the MACD on the 60min charts along with being overbought has rolled and crossed over with today's price action. So, while again until we see a break of support I can't fully rule out seeing this push a bit higher before topping with either the green or yellow counts, the downside potential is still greater than the upside as Avi had noted in his weekend update.
Other than that I really do not have too much to add to what I had noted last week in regards to the yellow and green counts, and we really will just need to see how deep the next pullback is which should give us a better idea as to which of these paths we are following.
Yellow Count
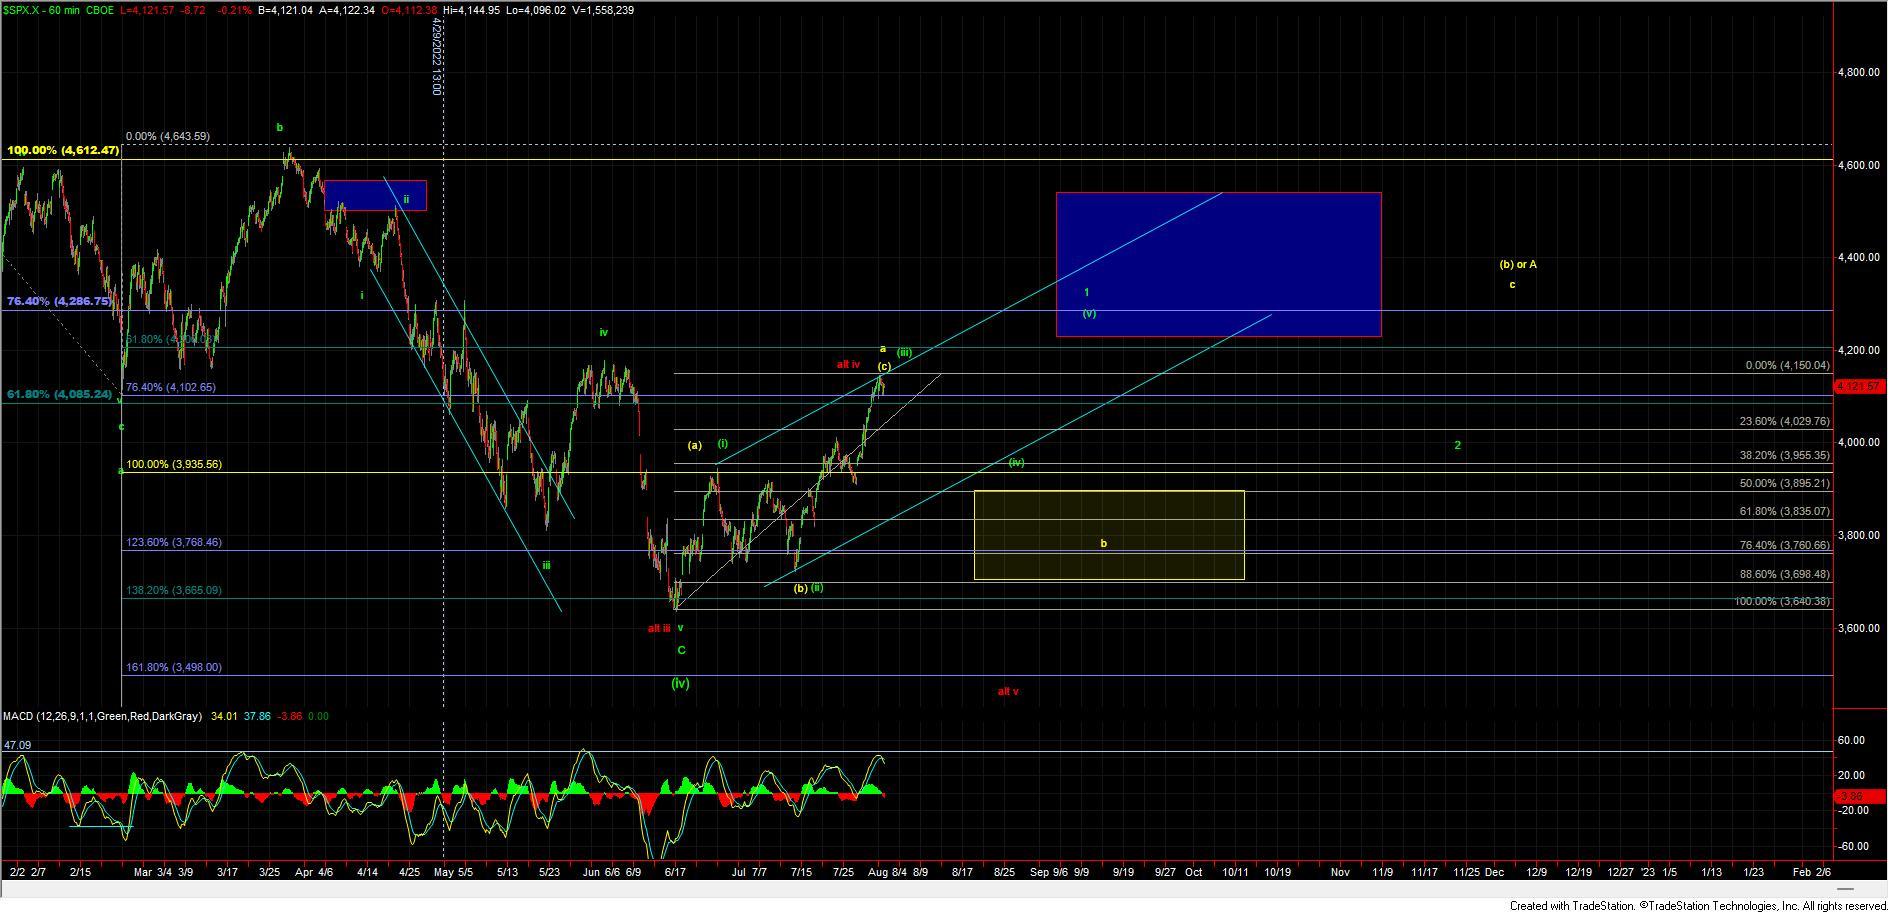
I still personally still prefer this count over the green count for a number of reasons but I will note that it is not a heavy favorite and I will certainly be open to the green count and let the price and pattern dictate which path we are indeed following once we do top. This yellow count would suggest that we are following an ABC up off of the June lows with the wave (c) of that ABC coming into completion near current levels in the form of an ending diagonal. As it is typical for the reversal out of an Ending Diagonal to be quite sharp back to the origination point if we are indeed following this yellow count I would expect to see a sharp move lower that ultimately targets the 3736 level below. I would want to see this move below the 3994 level followed by a break under the 3909 level to give us confirmation that we have indeed topped in this yellow count. Again this should be a fairly swift reversal to the downside under this yellow count so If we do break under the 3994 level but see a more muted move down then I think it would become more probable that we are following the green wave (iv) retrace.
Green Count
Under that green count, we still should see a pullback towards the 3950-3900 region and that pullback should take the form of a three-wave move. We should however see another higher high back over the current high to complete a potential leading diagonal up off of the lows. The initial move down off of the highs will likely be very similar to that of the yellow count but again the drop will not be nearly as sharp or deep before turning higher once again. Additionally, once this does bottom in the wave (iv) the final leg up for the wave (v) of 1 is likely going to give us more sloppy action as it should take the form of another three-wave move to fill out the last leg of the leading diagonal.
So, while this price action is still quite sloppy and we do have to allow for a bit wider parameters due to the lack of impulsive price action, we do still have fairly clear parameters to work with here. What I will note is that if we are indeed following the yellow path, I would expect the drop to be fairly sharp, so if we do not see the next leg down come quickly I think it would certainly give us a good signal that the green count may indeed be the operative count. For now, however, patience will be the key here, and we simply need to wait to see how this market reacts to the price levels laid out in the coming days and weeks.