Market Hiding Its Immediate Intention
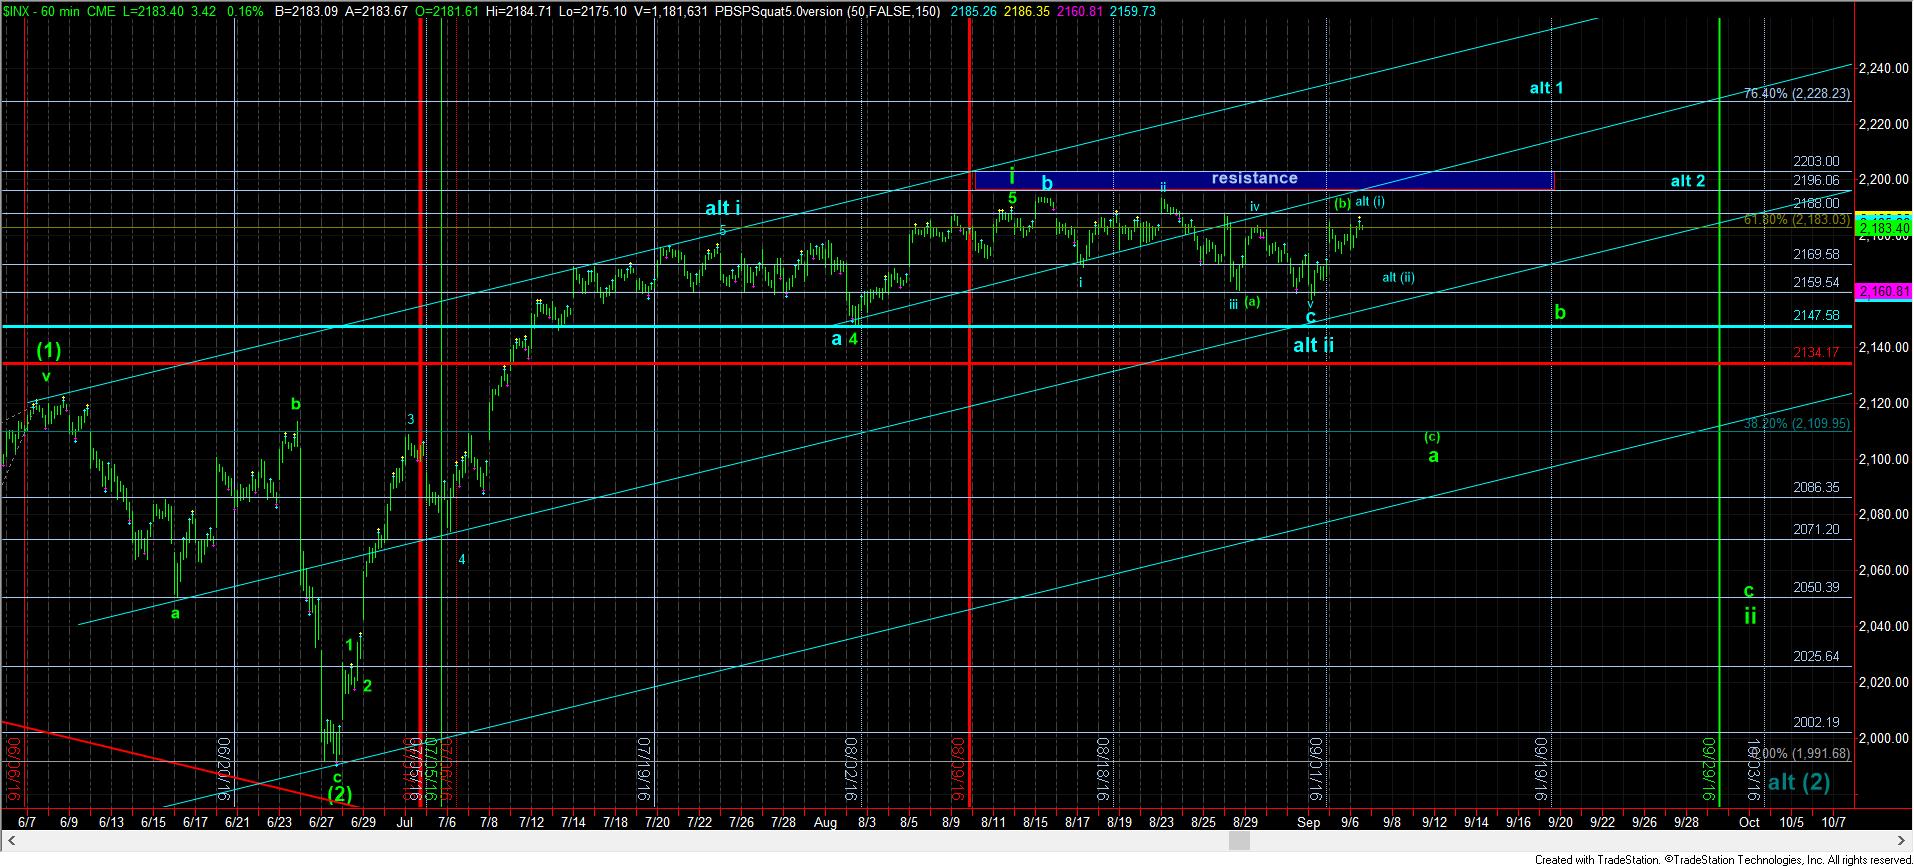
Today, the market moved higher to complete the structure off last week’s low. The question now is what that structure represents?
As you can see from the attached SPX 60 minute chart, this rally has either completed the green (b) wave, or is the blue wave (i) for wave 1 of iii of (3) in the more immediately bullish blue count. However, I am unable to discern which is the more “correct” pattern, until we start to see the next drop. Should it be clearly impulsive, then it would strongly favor the green count to develop a bigger pullback. However, if it is corrective and then we take out resistance, then I am in the blue count, and potentially targeting 2350 by the end of this year.
So, where this leaves me as of today is that I would “prefer” to view us still within the green count, as long as we remain below our cited resistance between 2188-2196SPX. But, with the break out we experienced in emerging markets today, I am beginning to have some doubts about seeing a bigger pullback. Therefore, the market is going to have to be our guide on the next pullback or break out.
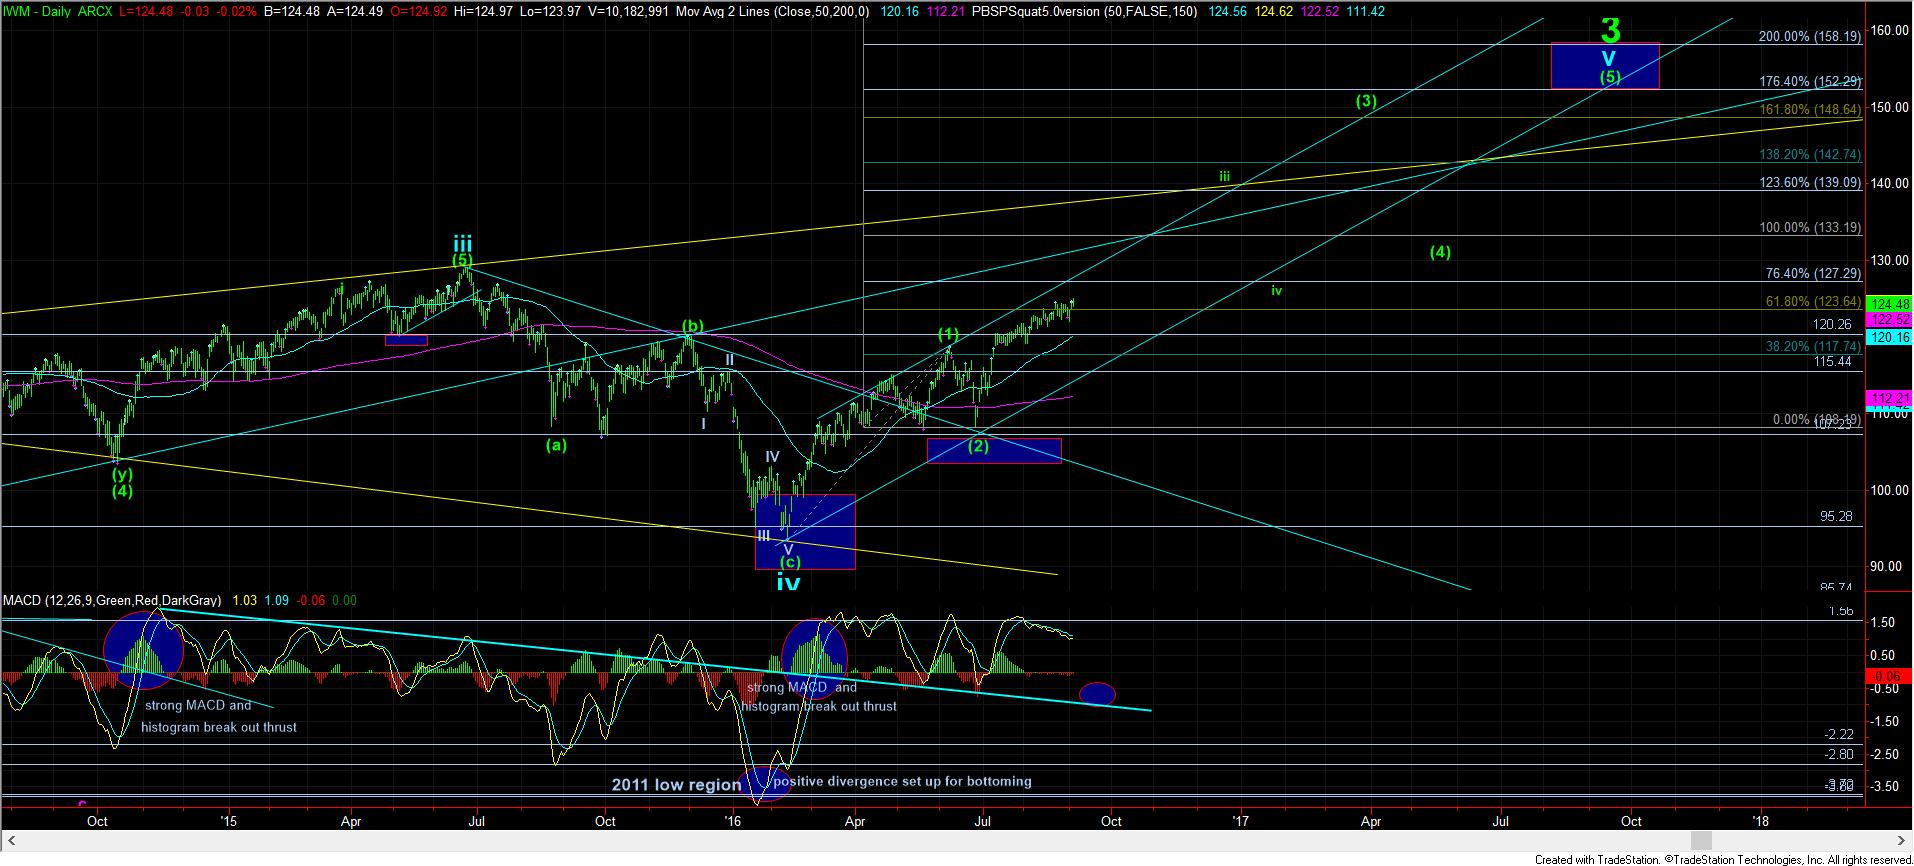
Lastly, I want to take a step back and point out the daily IWM chart. As I have been reiterating all year, this is a very bullish looking chart. It suggests we are going to be much higher in the coming 12 months than where we reside right now. The only question is if we continue to melt up into the end of the year, or if we see that pullback. But, under either circumstance, this chart is strongly suggestive that much higher levels are going to be seen in our equity markets.