Market Has Not Likely “Topped” Yet
There is no question the market action becomes more and more messy as each day goes by. And, early this week, once we broke below the 2572SPX region, I warned you that wither we see a (c) wave down, or an ending diagonal up, it will likely mean we see volatility and whipsaw. To that end, the market has been true to form.
But, even so, the market has held all potential patterns in place, and its true immediate intention quite close to the vest. Moreover, I have even added one more potential pattern to the chart, which is presented in purple, and is a triangle for wave iv.
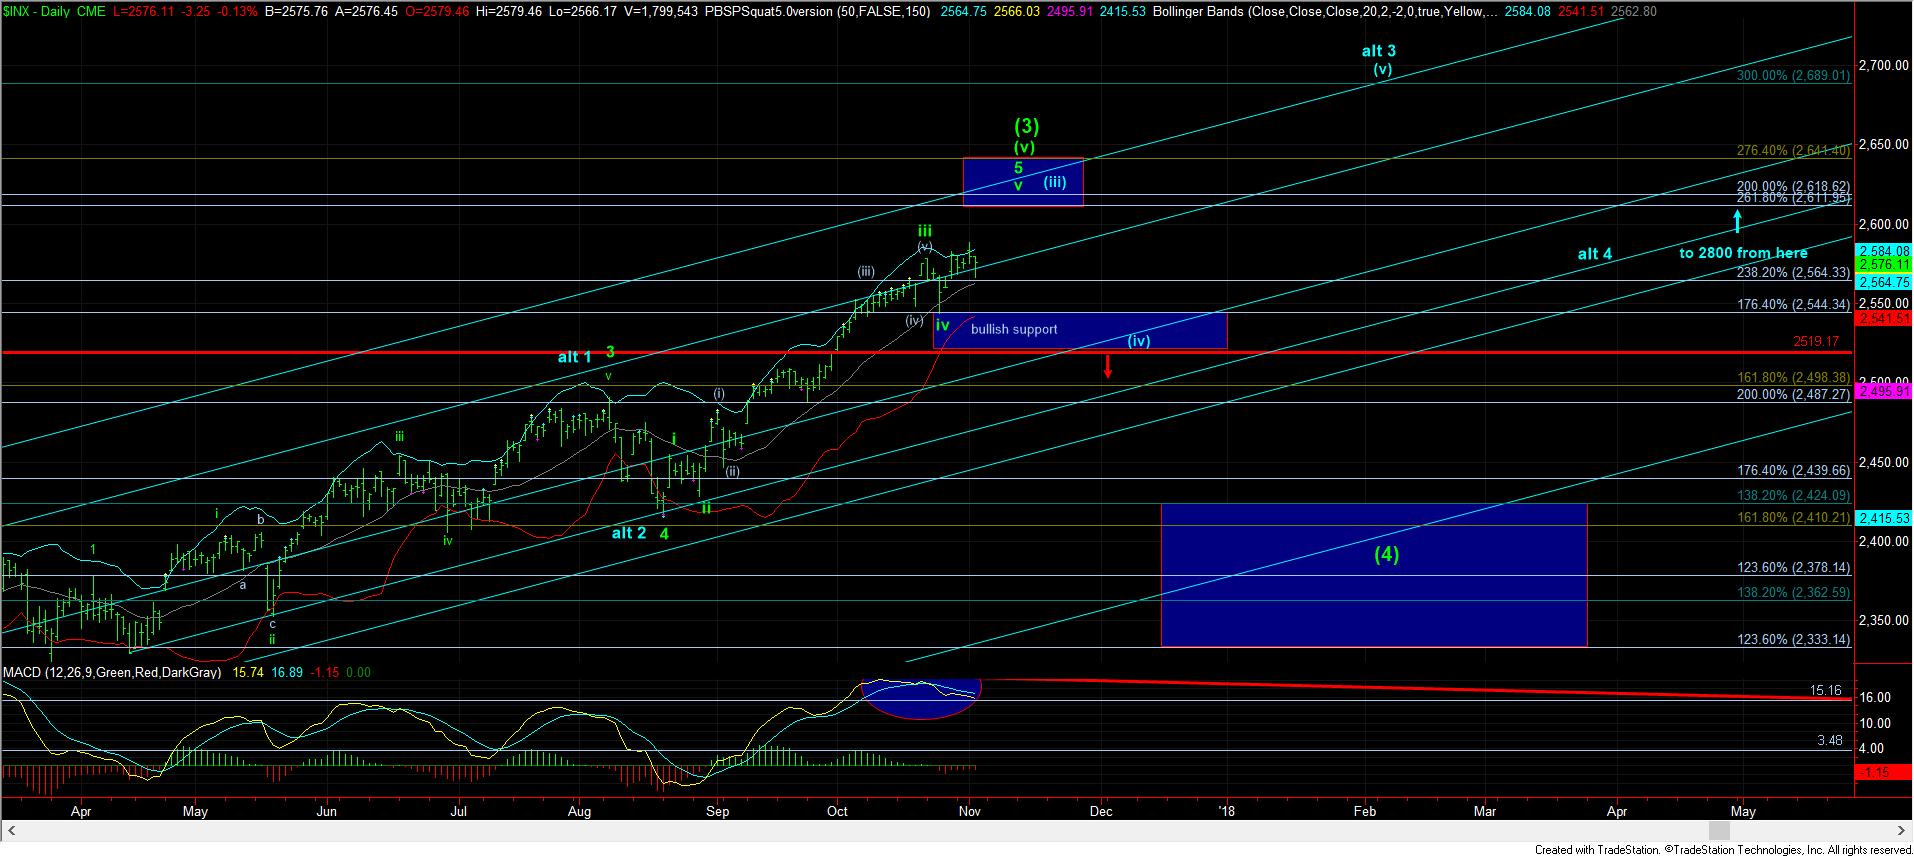
Ultimately, what it means to me is that this region is offering no strong high-probability set ups to bulls or bears, but there is no question that the bulls are still well in control. You see, based upon the set-up we are seeing, the most bearish structure I can make out in the immediate patterns is a (c) wave down towards the 2520-2550SPX region to complete a larger wave iv, which will still likely set the market up for a rally towards the 2600+ region. So, to that end, I still do not think we are ripe yet to see a bigger pullback. And, as I shared with you yesterday, the IWM also strongly suggests that we “should” see one more rally before a 5 wave structure has completed.
Lastly, I want to re-post something I posted as an alert earlier today, as it presents both sides of the market rather well:
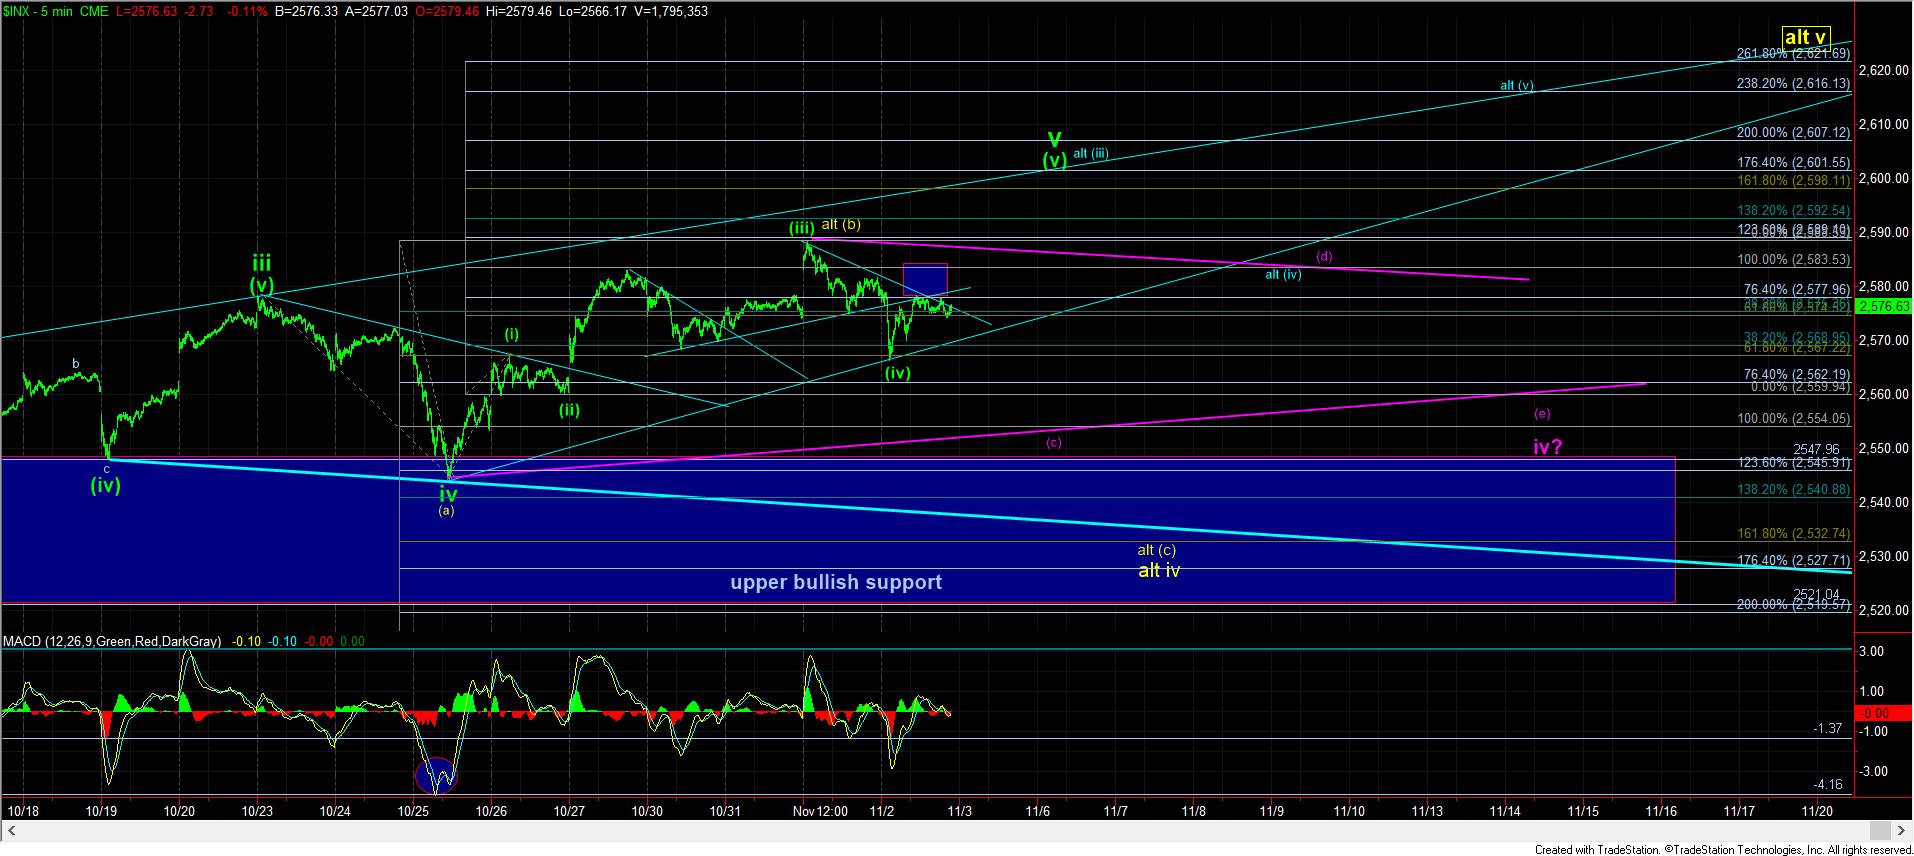
Allow me to present both sides of the market yet again. The rally up has been very corrective looking and overlapping. Normally, it is suggestive of structures like b-waves.
However, this structure has been acting more like a diagonal, wherein now we can view the wave (iii) striking the 1.236 extension, which is commonly where a 3rd wave strikes within a diagonal. Moreover, we have overlap in waves (iv) and (i).
But, take note that every time in this diagonal that we have created some form of downtrend, the market only gaps up through that downtrend line the following day.
So, again, this is a bull market, and it would seem that we should be looking up until we get to 2600 or higher. But, just recognize the real potential for either a (c) wave down in yellow, or even a triangle, as shown in purple.
Under all circumstances, it suggests that the market is heading higher. The only question is if we need more of a pullback before it happens.
So, while the bulls still have the ball, and may attempt one more push higher in the near term, any immediate downside follow through can take us back down towards the 2520-50SPX region, whether it be for the (c) wave of the triangle, or the (c) wave lower in a larger degree flat for wave iv. I cannot say the structure is strongly suggesting any of these potentials at this point. But, consider that the bulls still have the ball, and will retain the ball even if we drop down towards support, which would simply be akin to being sacked with a 5 yard loss after a 2nd down pass play. A 3rd down will still likely follow.