Market Has Been Quite Resilient
With the market still holding support overnight, we still have nothing pointing to a top being in place, other than having enough waves in place to consider a top to an (a) wave. This would then set us up for a (b) wave pullback, which would take us down approximately 1.5-2% lower.
However, that being said, there is also a very bullish micro count on the table which, if triggered, would take us over the 2137SPX level, and potentially up to the 2154SPX level in quick fashion.
As I noted in an earlier update today:
Since 5th waves are not the strongest - rather, 3rd's are - 5th waves in 3rd waves are often the longest. Therefore, I am going to have to note this potential for you to at least recognize it if it should occur.
IF we are able to complete another 5 waves up today, then we can classify it as one of two ways. First, it can clearly be the top of an (a) wave in the diagonal potential we have been discussing. That would lead us below today's low, and take us down in the (b) wave.
However, the second way could classify that is as a setup to an extended 5 of iii in green. The only way we will know if that is on the table is if we complete 5 waves up today, pullback correctively, and then take out the high of this current 5 waves. That would put our next target at 2154SPX, with potential to even exceed that.
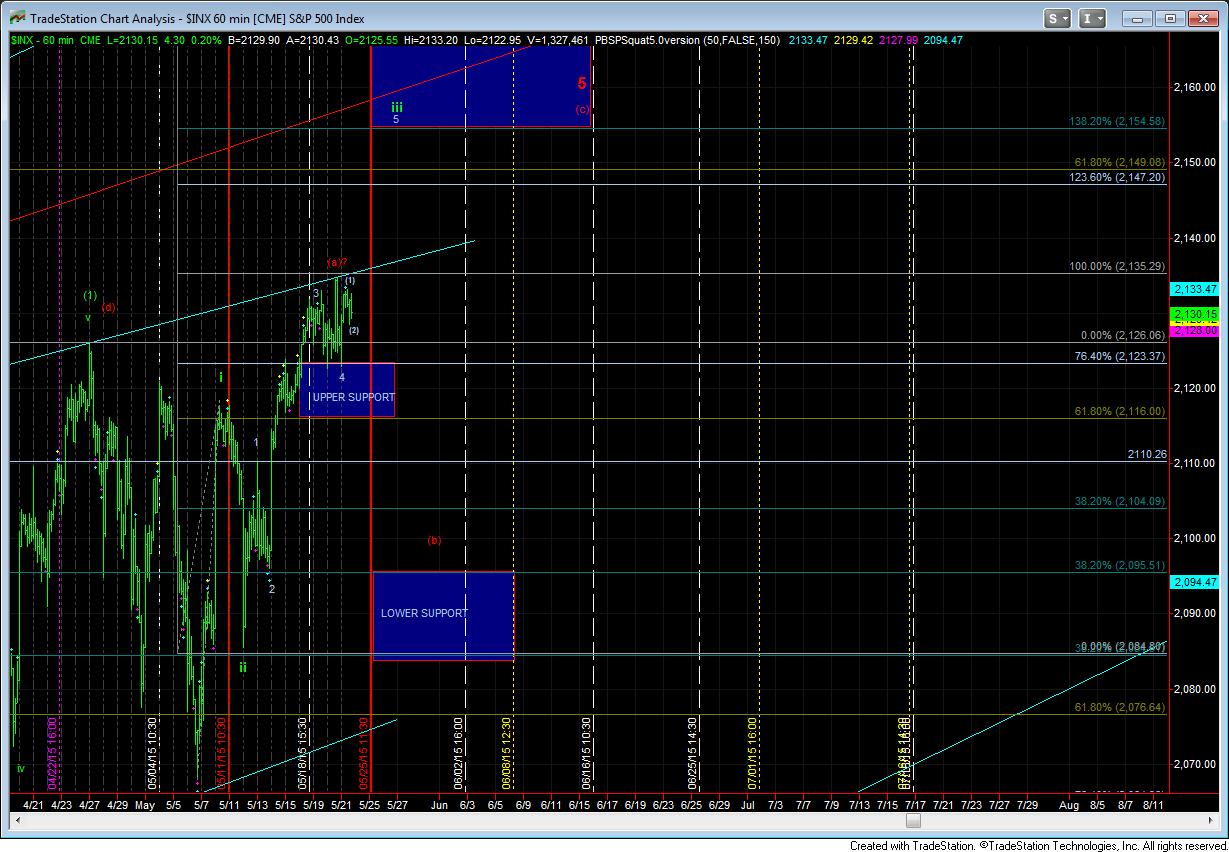
This bullish potential is marked as the (1)(2) on the turn chart, which would take us to the higher target box on the chart towards 2154SPX.
This leaves us with today’s low in the SPX at 2123 as the major pivot in this region. As long as we remain over that level, I will be looking higher, and potentially as high as 2154 next. However, should the market break that pivot, that opens us up to the (b) wave much lower. And, it would take a break of the lower support region to make me consider that a bigger topping pattern has been completed.