Market Has A Failure To Launch But It Is Still Over Support
 By
By
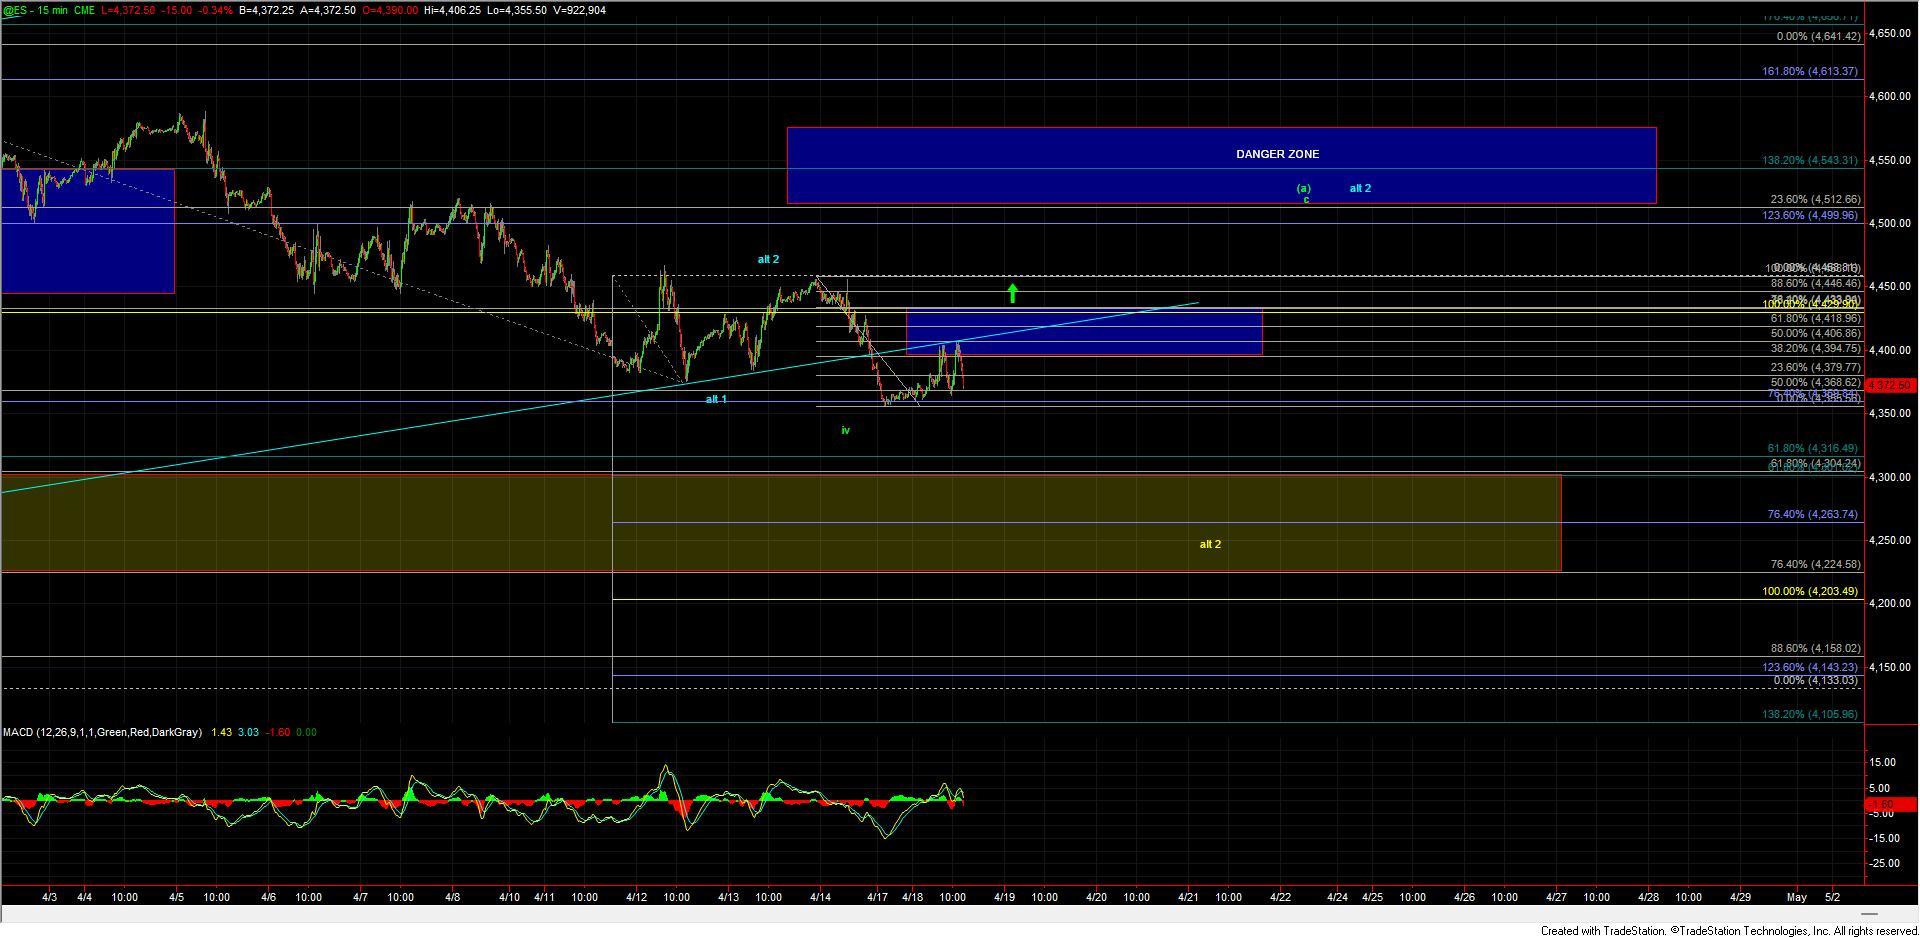
Overnight we saw the Emini S&P 500 (ES) push lower breaking the lows that were struck last week only to find some support into the early trading session and push slightly higher. That move, however, was not terribly strong and ended up giving us a fairly clear corrective wave pattern that failed to push through even the lower end of the micro support zone at the 4430 level as laid out on the ES chart.
As we move into the close the market is pushing lower once again and looks like it wants to once again re-test the lows that were struck overnight, thus signaling that the market is not quite ready to find that local bottom just yet. We are still sitting over the larger degree support levels for now, which is keeping alive all of the counts that Avi laid out in the weekend update, thus leaving the charts in a bit of no-mans-land as we end the first trading day of the week.
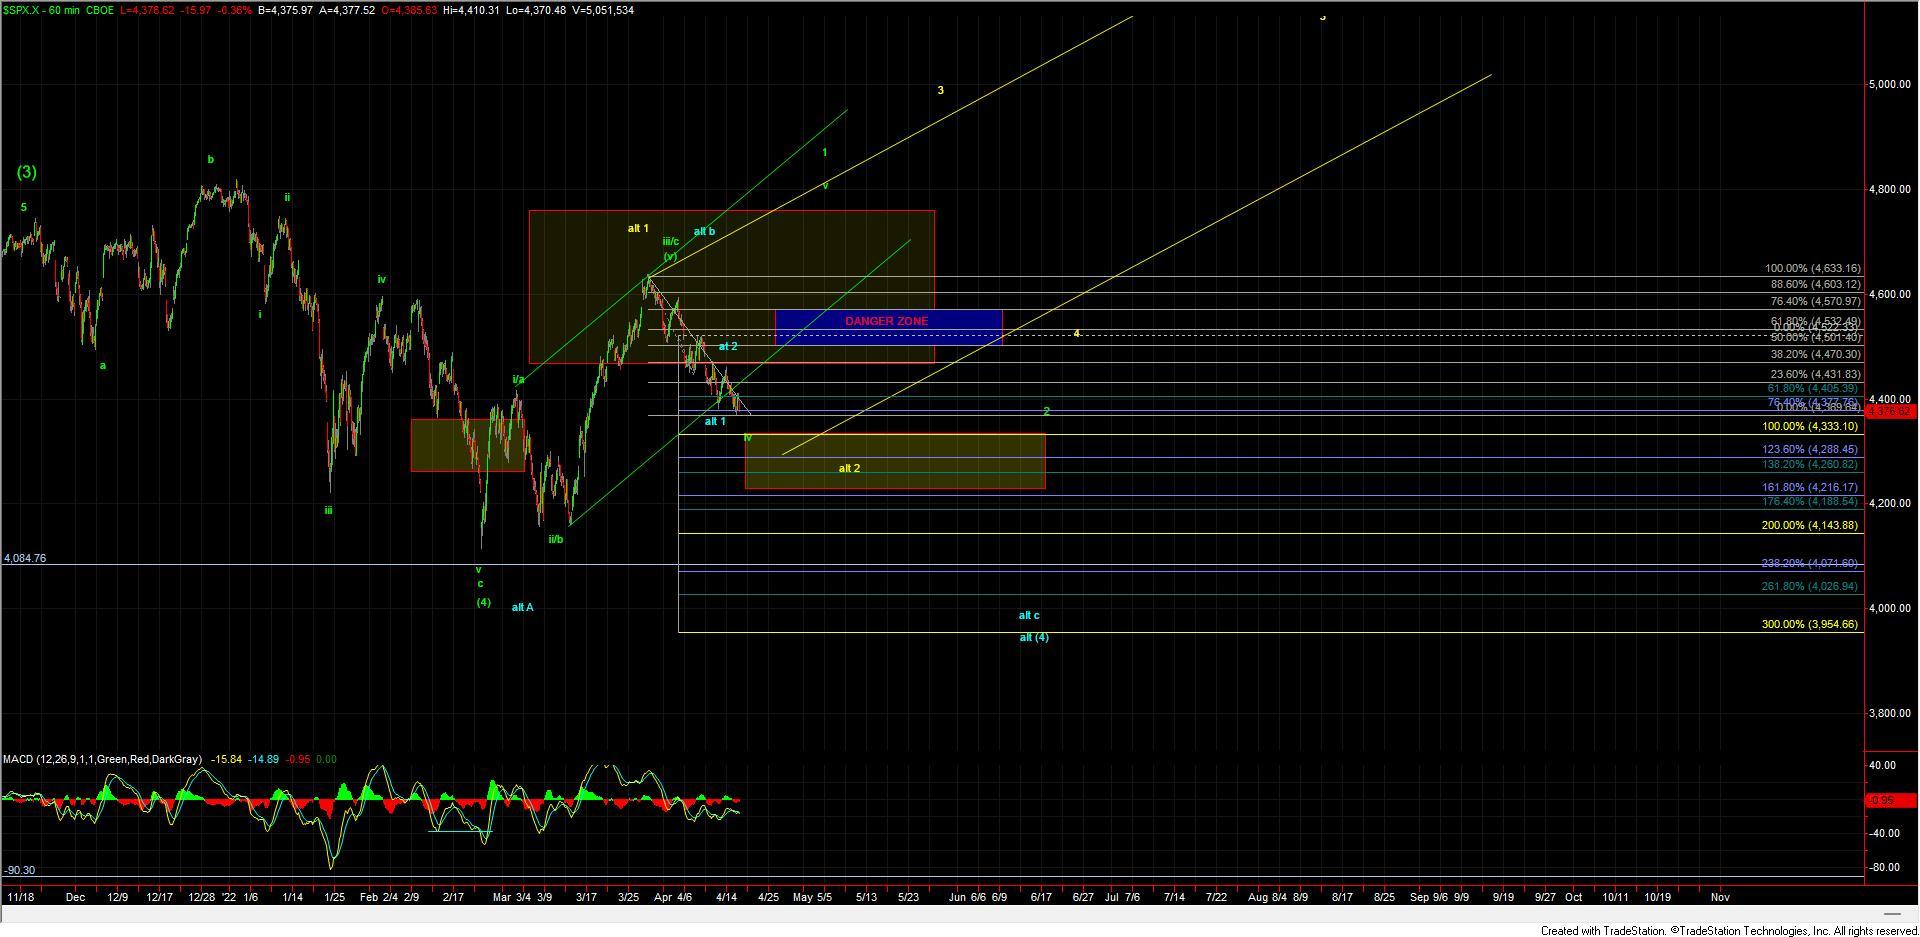
So while the odds are certainly not heavily favoring one count over the other at the moment, as long as this can hold over the 4333 level on the SPX I am going to give the benefit of the doubt to the green count. This count is still suggestive that we need another push higher for the wave v of 1 to finish off the leading diagonal up off of the Feb lows. Should we see a break of this level, then it would open the door to either the blue count taking this down to new lows or potentially the yellow count, which would suggest we are in a larger ending diagonal up off of the Feb lows to finish off the wave (5). If we do break that 4333 level I personally would be slightly leaning towards the yellow count over the blue count; however, neither is ideal and both have their issues. So, as to not get too far ahead of myself, I am going to wait to see if we do indeed break that 4333 level before I opine further on this, and will see what that pattern looks like if we do indeed move down into these levels.
As far as the green primary count is concerned, from here we need to hold that 4333 level, then push back up over the 4470 level on the SPX to give us a signal that a bottom may indeed be in place. From there we still would need to get through the larger resistance overhead in the 4532-4570 zone to give us additional confirmation of a bottom. Until those levels are taken out I am still cautious on both sides of this and as we have been noting for some time this price action is likely going to be quite sloppy for the next several weeks regardless of whether we move up or down. This will remain the case until we either get the full five up under the green count or make another lower low under the blue count. IF we happen to follow the yellow count, then we are likely to see sloppy price action into the end of the summer at a minimum.
So, with that and in summary, this is simply not the place to be overly aggressive for short-term traders in the near term as this price action will likely chop most up as it remains sloppy and somewhat unreliable in the short-term timeframes. Bigger picture we do still have fairly well-defined risk parameters as Avi noted in the weekend update, but again the smaller timeframes to remain quite sloppy.