Market Grinding Its Way Higher
 By
By
After finding support on Monday and pushing higher, we've continued to see the market grind its way toward new all-time highs. While this move has certainly exceeded initial expectations regarding the depth of the rally off the April lows, the internal structure of that rally still leaves the bigger-picture count unchanged.
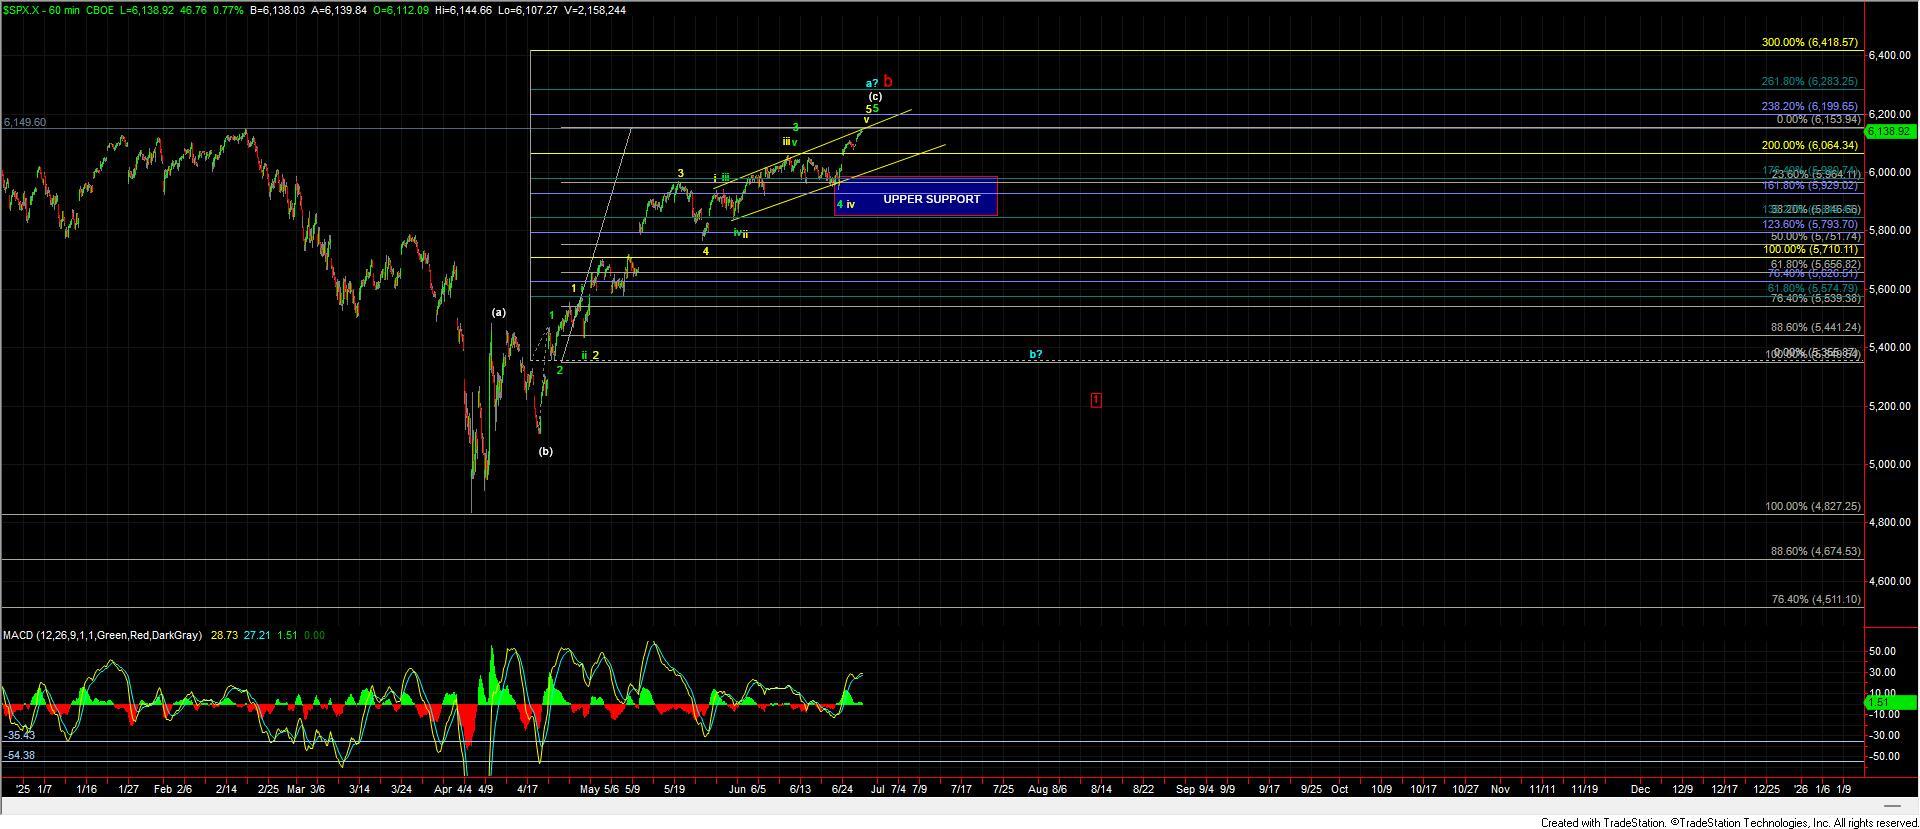
One complicating factor has been the growing divergence between the ES and SPX charts, particularly due to the number of significant overnight moves that never appeared on the cash SPX chart. As such, while the larger degree structure remains largely intact, the subdivision of this C wave off the April 17th low can be interpreted in a number of viable ways. On the charts, I’ve highlighted the two primary paths I’m tracking, shown in green and yellow.
Just to reiterate: the broader move off the April low still counts best as an (a)-(b)-(c) corrective structure, with this current rally likely representing the last portion of that pattern.
Yellow Count Subdivision
Earlier this week, I began favoring the potential for an Ending Diagonal (ED) forming off the May 23rd low, particularly after the market held support into Monday and failed to break down last week. This count is shown in yellow on the charts and remains technically valid on both the SPX and SPY charts.
However, it did invalidate on the ES chart due to overnight action that briefly broke the upper boundary before reversing ahead of the cash open. While this throws some doubt into the setup, I’m not ready to completely abandon the yellow count just yet, as it still offers the cleanest and most straightforward way to count the subdivisions of wave (c) off the April 17th low.
Under this scenario, we’d be expecting a top to form sooner rather than later, followed by a sharp reversal back toward the May 23rd low. A break below the 5980–5846 zone would be our initial confirmation that a top is in place under this count, with a quick follow-through to the May 23rd low likely to follow.
Green Count Subdivision
The green count is quite similar to the yellow in that it suggests we’re nearing a top at current levels, though it subdivides differently. In this scenario, the rally off the April 17th low is counted as a series of nested 1-2s, with the market currently in the final wave 5 of that structure.
If this is the correct path, then we’re still in a topping region, though the subsequent reversal may not be as sharp as what we’d expect under the yellow count, given there’s no ED in play here. This count also allows for potential upside extension, with the next fib resistance coming in at 6199 and then 6283 above that.
Support for this count likewise sits in the 5980–5846 zone, and a break below that area would suggest we've topped, regardless of whether it’s within the yellow or green structure.
Bigger Picture
The larger-degree count remains unchanged for now. Ultimately, the key to determining which path we're following will come from the structure of the next move down after we break support as noted above. If we see a full five-wave decline, it would point to a top forming in the larger-degree red wave b. On the other hand, if the move down resolves as a three-wave correction, it would favor the idea of this being part of a blue wave b retracement.