Market Gives Us Further Confirmation That At Least A Local Top Has Been Seen
 By
By
Today the market opened lower and continued to push to new lows during the morning trading session. We managed to find support in the afternoon and have since pushed higher up off of those lows and are now currently testing a key micro pivot which will potentially tell us whether we are going to see a more immediate breakdown back under today's low of the day or whether we are rather going to see a deeper retrace higher before moving lower.
In both of the counts that I am watching however, the move under yesterday's LOD has given us further confirmation that we have indeed put in at least a local top making it like that the market will still see lower levels before any move is seen back up over the 4448 high.
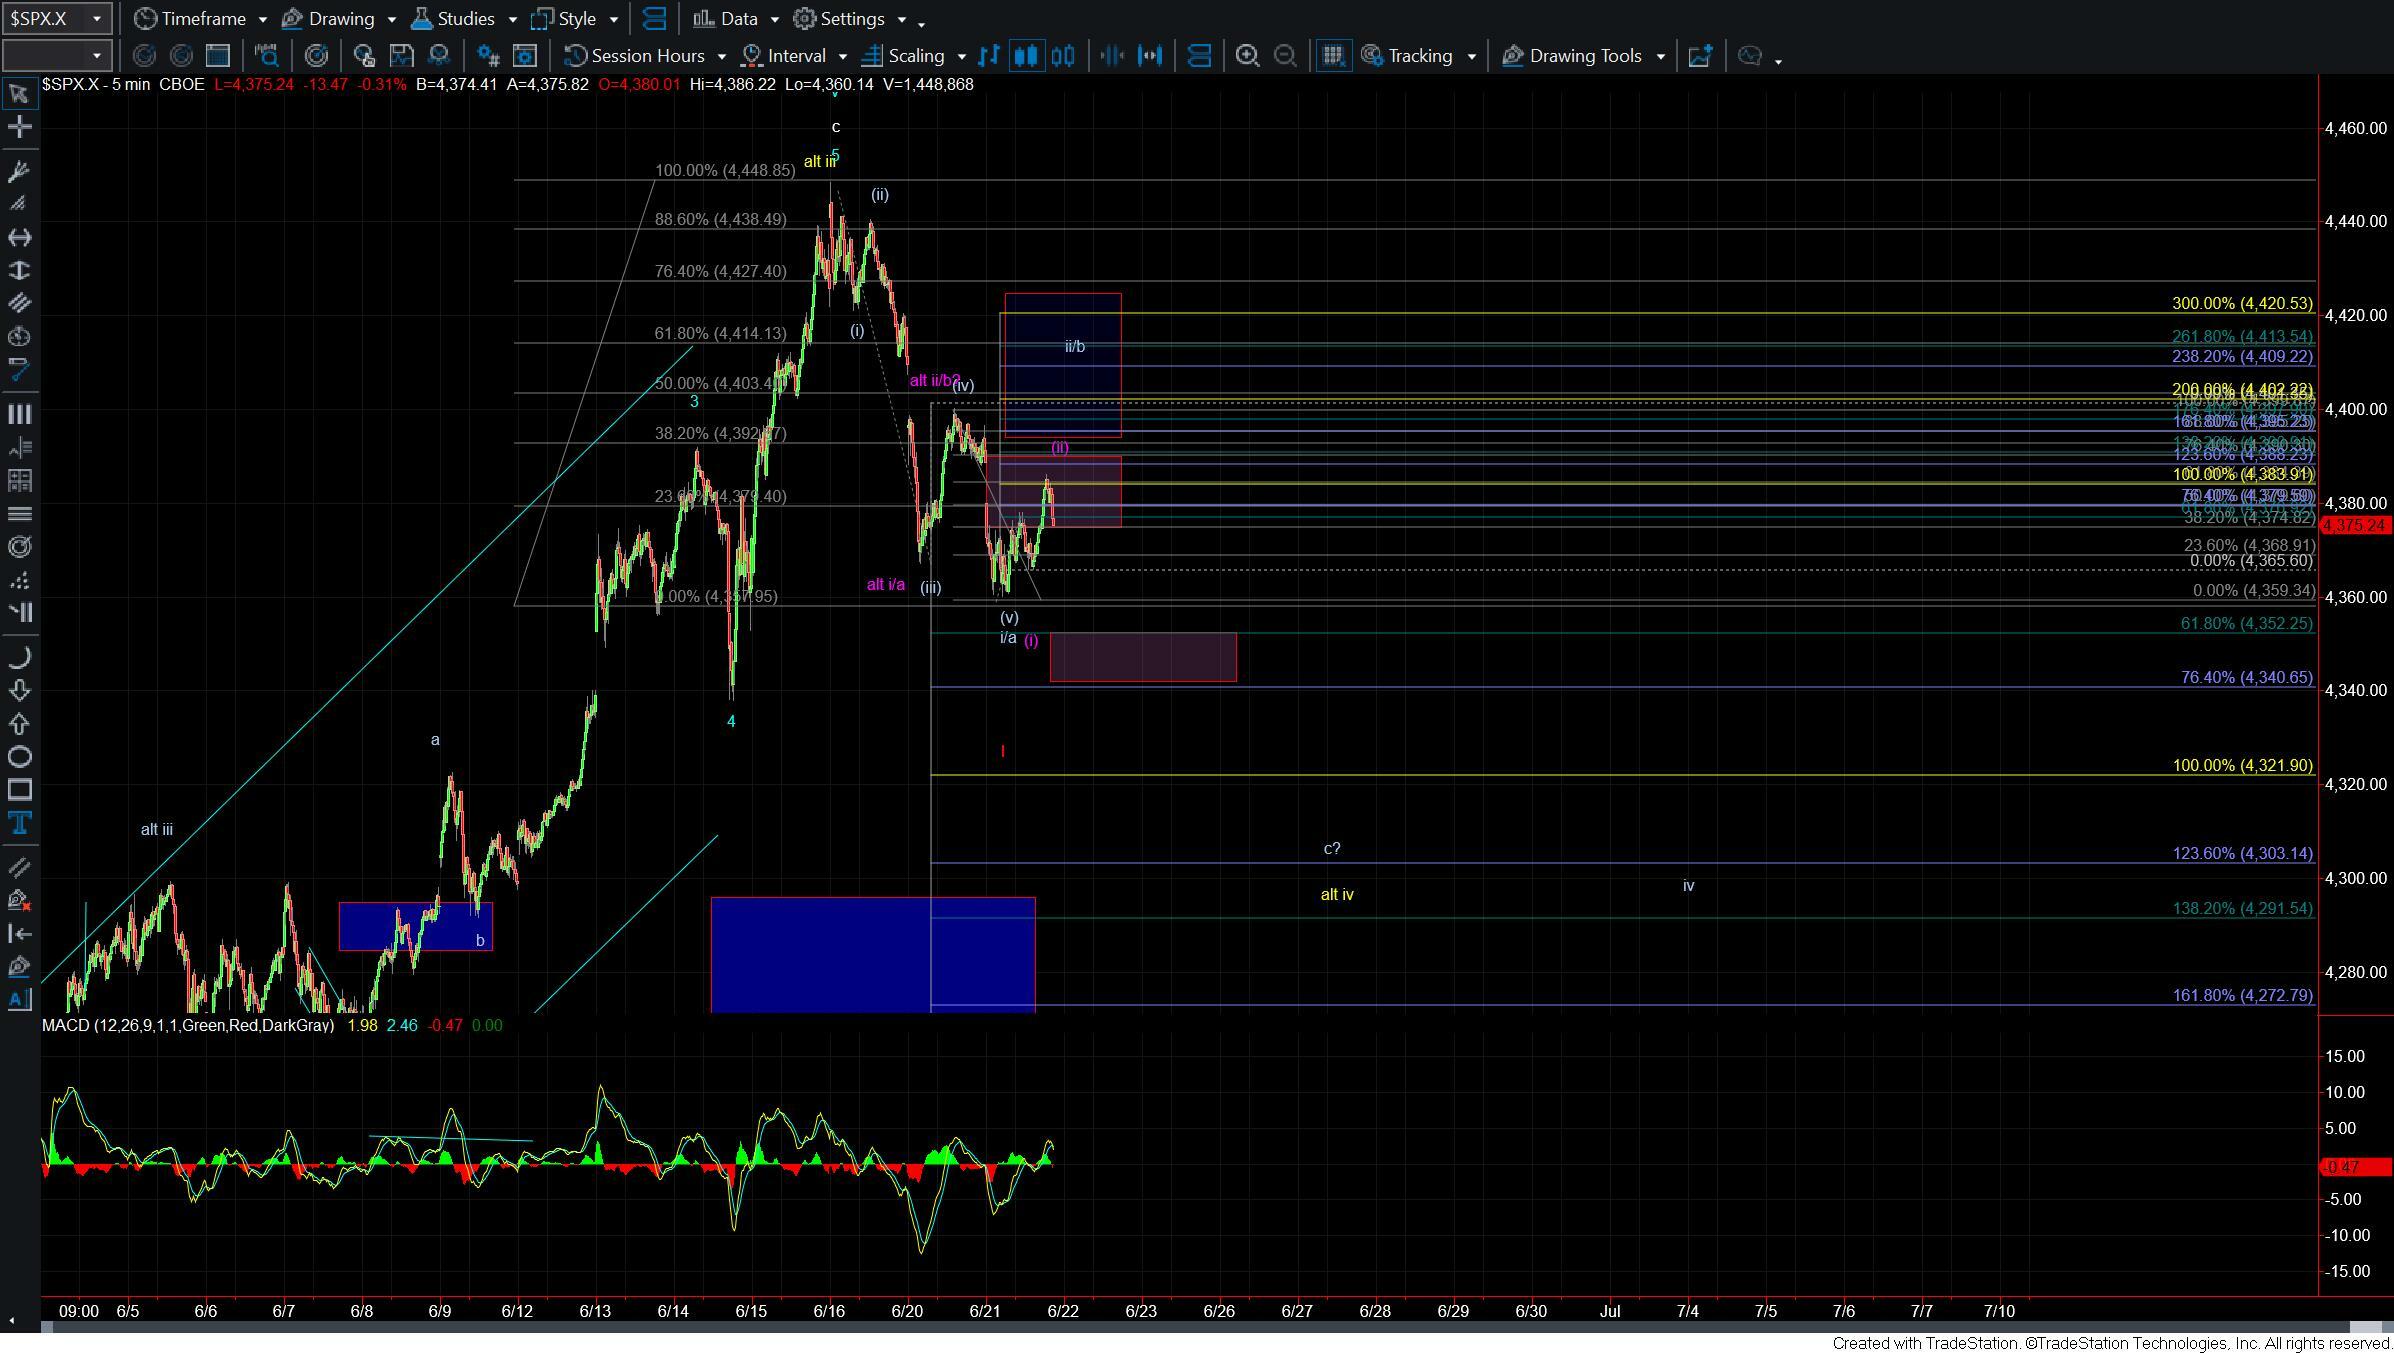
On the micro timescales as shown on the five-minute chart I am watching two counts at the moment. The first and primary cont is shown in white and would suggest that today's LOD was a wave (v) of i/a. That would make the push up off of today's low part of a wave ii/b. Under this scenario, I would want to see the market push back up through the 4390 level which represents the 76.4 retrace of the move down off of the 4400 level. This would then set up a push to resistance sitting in the 4392-4427 zone which is the 38.2-76.4% retrace of the move down off of the 4448 high. From there I would be looking for a five wave move down off of one of the key fib resistance levels followed by a break back under the 4360 low to signal the start of the next wave c/iii down.
If we are unable to break out over the 4390 level and then turn lower back under the LOD at the 4360 level then it would suggest we are following a more immediately bearish micro count as shown in purple in the form of a i-ii (i)-(ii) to the downside. Under this scenario the next key downside pivot would then come in at the 4352-4340 zone and moving through that zone would further confirm we are following this micro path.
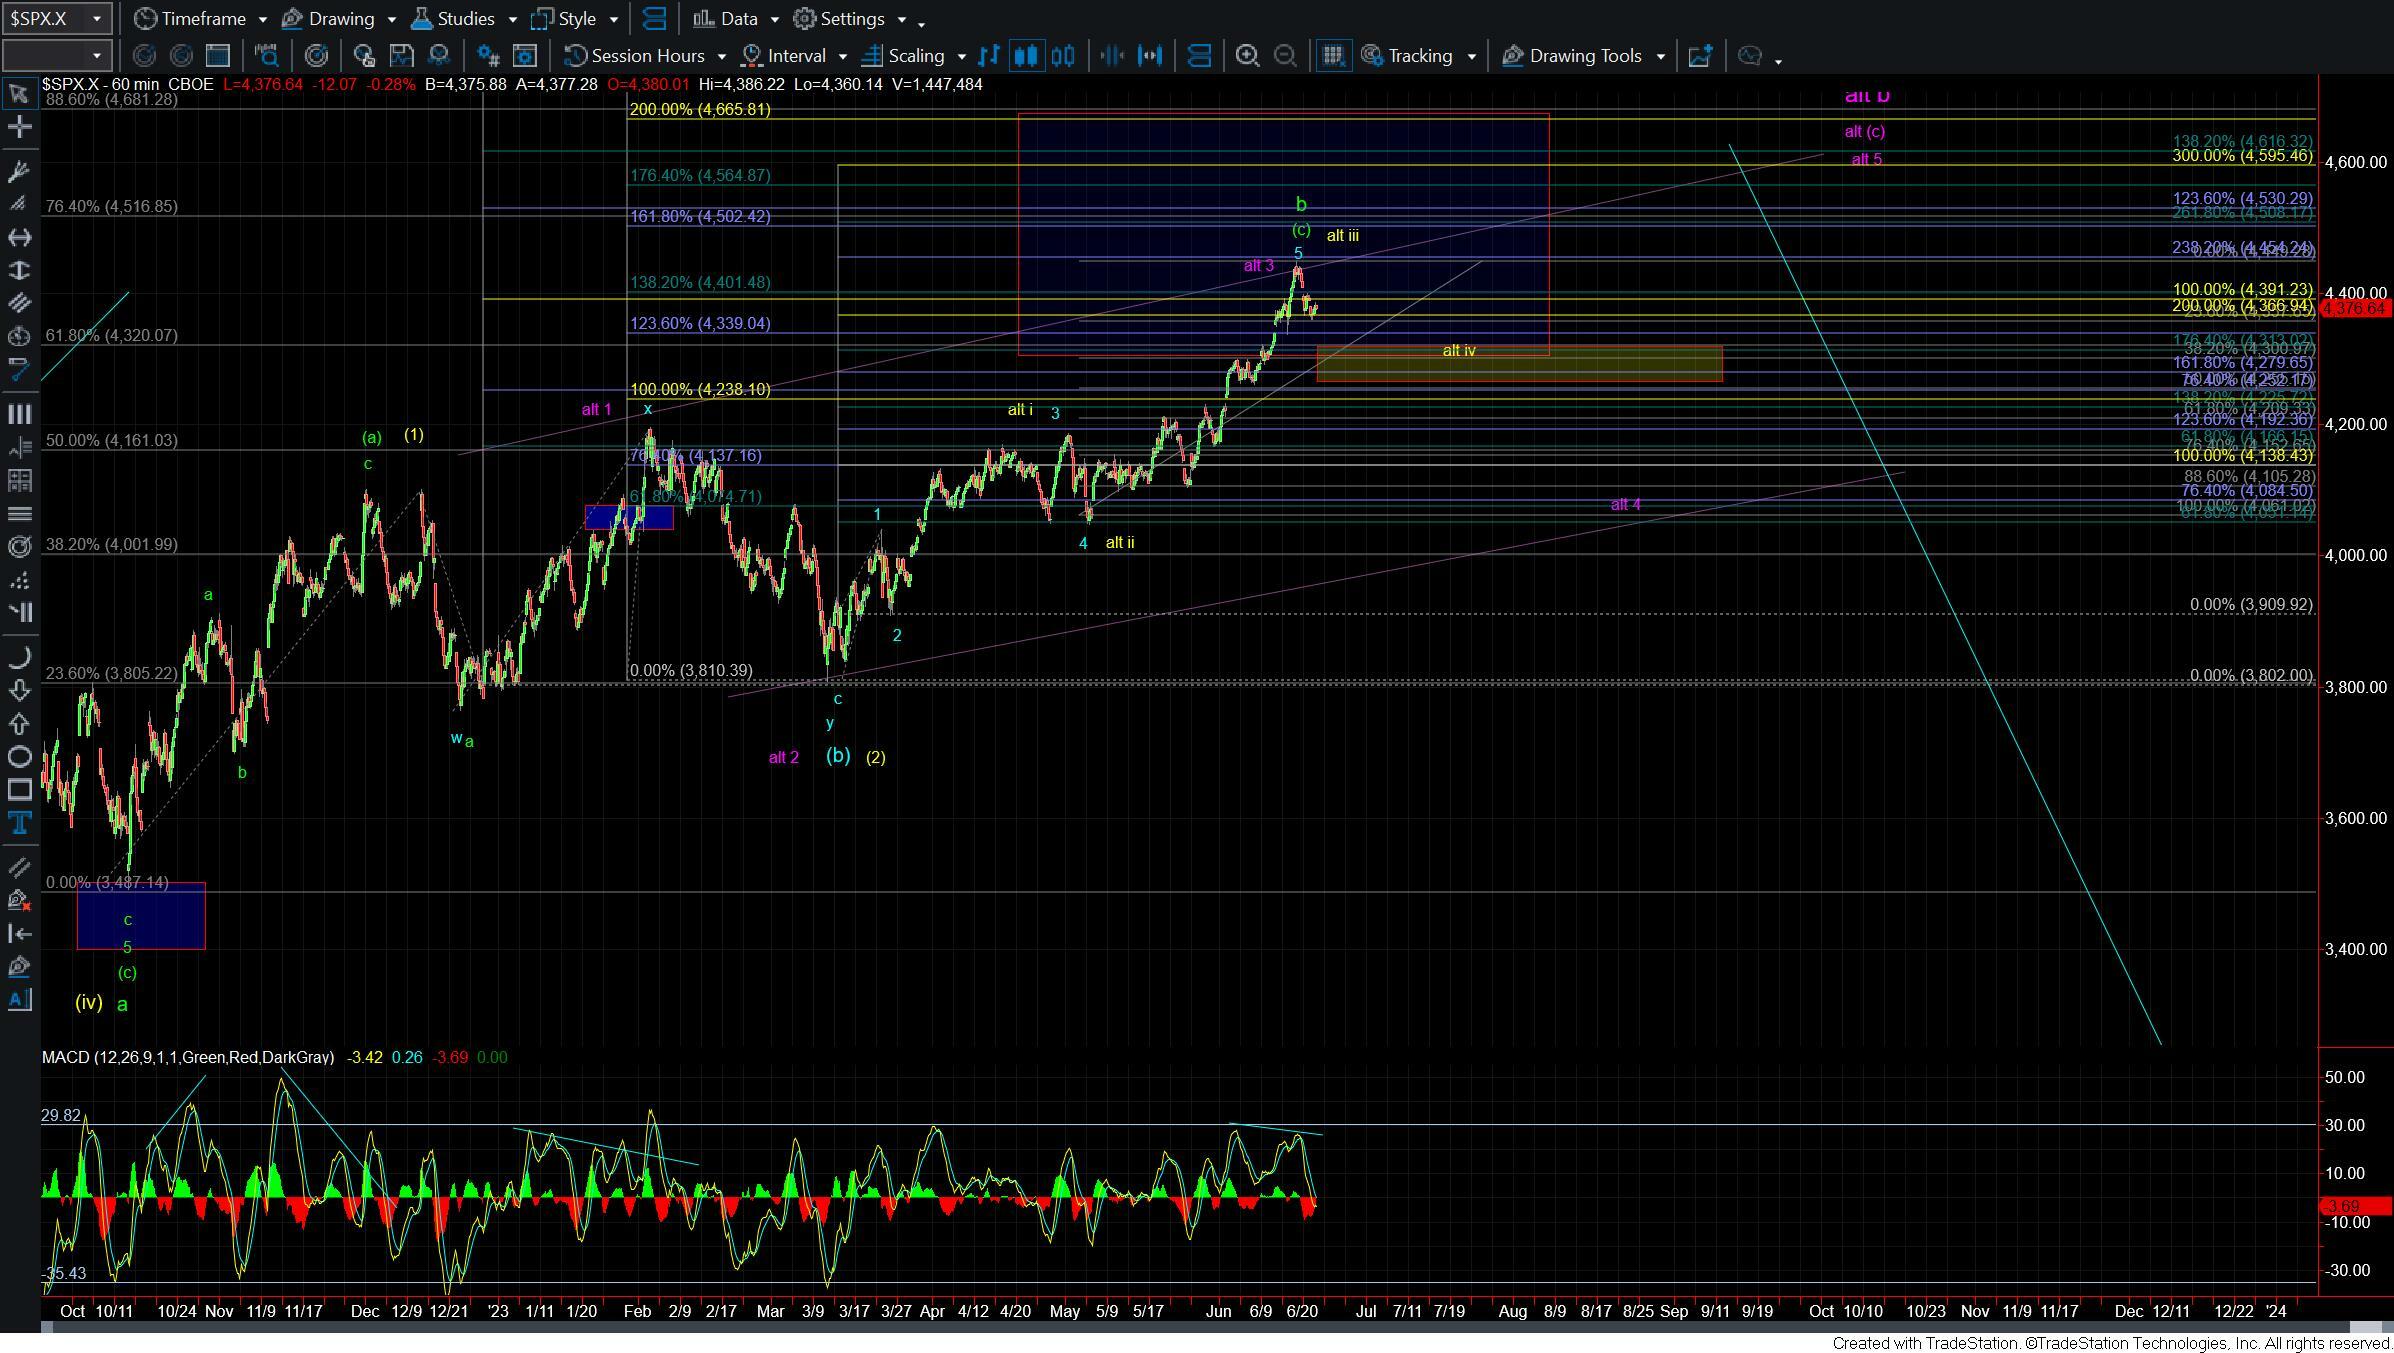
If and when we do break down to new lows we still will need to watch the structure of the move of one larger degree to help determine whether we are going to see a full five down off of the high which again would give us the initial signal that we may have topped in all of the green wave b as shown on the 60min chart. If we are unable to see a five-wave move develop to the downside but rather see a three-wave start to the next larger degree move then it would suggest that this leg down is simply a corrective move as shown by the yellow or purple counts as laid out and discussed previously on the 60min chart.
So for now while we do look to have gotten further confirmation of at least a local top being in place the micro structure and path that this will take down to new lows is still a bit up in the air. The parameters however are fairly clear at this point and we should have an answer as to which path this is following in the next couple of trading sessions. From there it is simply a matter of following the pattern and fibs as we move through the price levels.