Market Getting A Bit More Dangerous
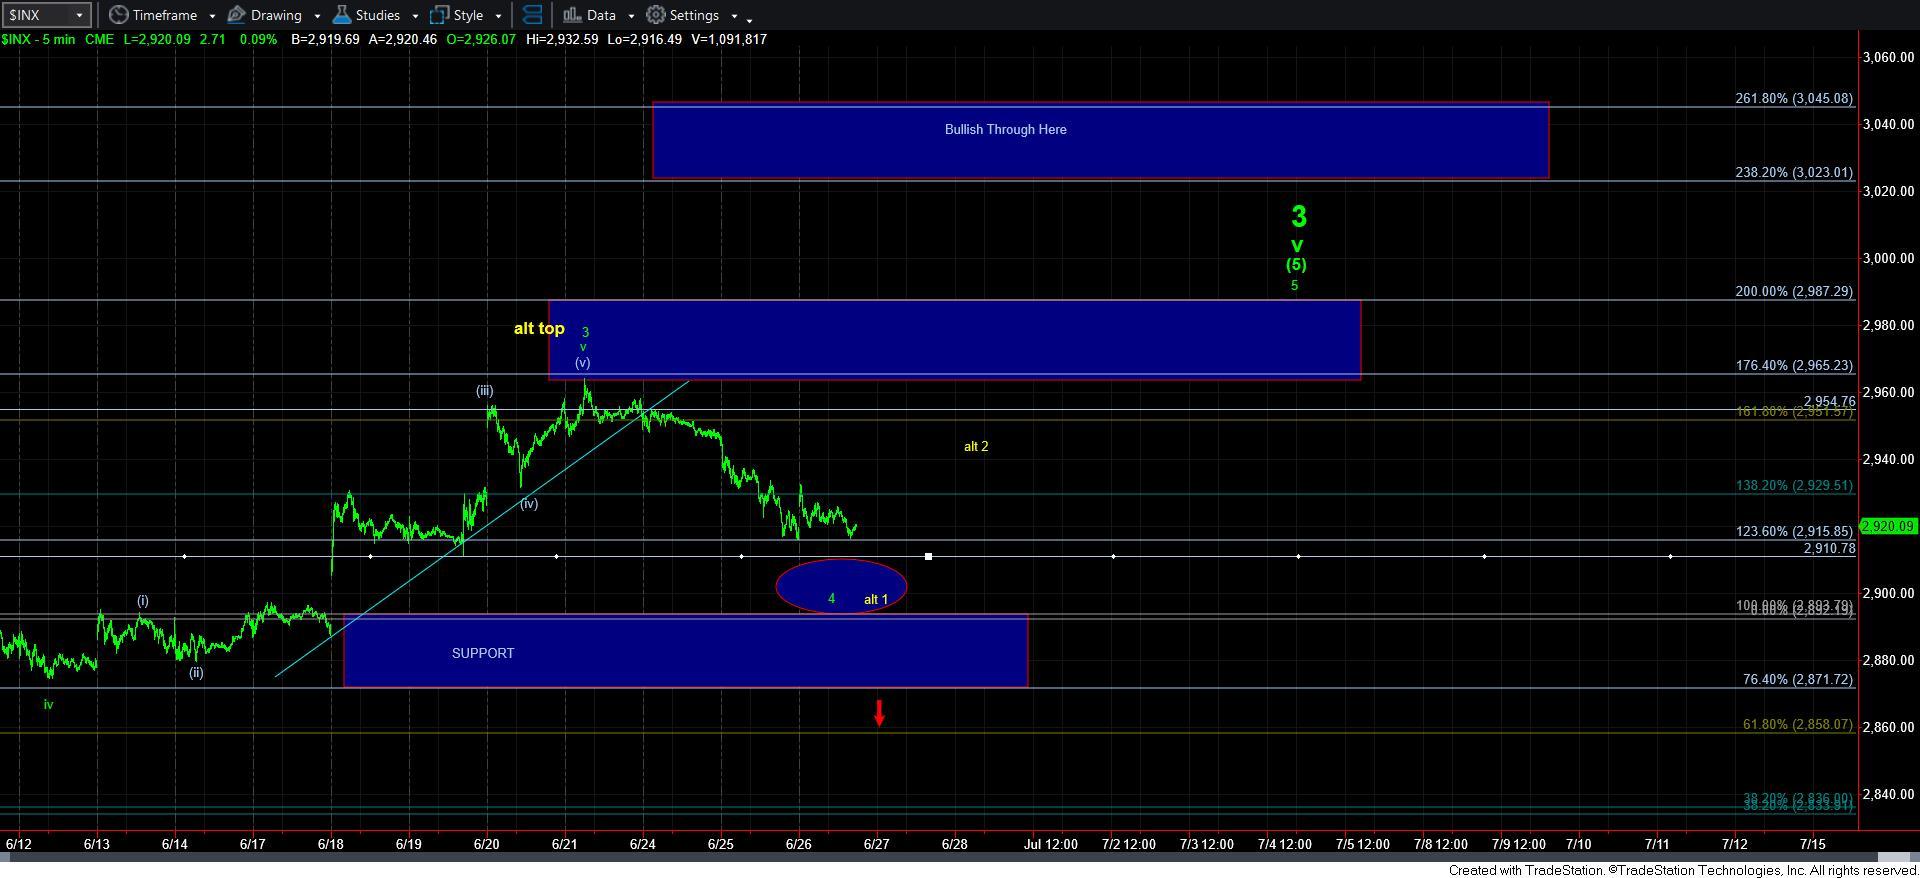
Today, the market was hovering over a support level, but has not confirmed that a bottom has been struck in this decline. Yet, as I noted many times, as long as we remain over 2890SPX, the market can complete a 5th wave higher, as shown on the 5-minute SPX chart.
But, I need to caution you about the potential for the market to be able to get that higher high. Since we struck the low in December of 2018, I still do not have a clear completed 5-wave structure to which I can point during this entire rally. So, it is still quite possible the market may fail to complete one at this time too.
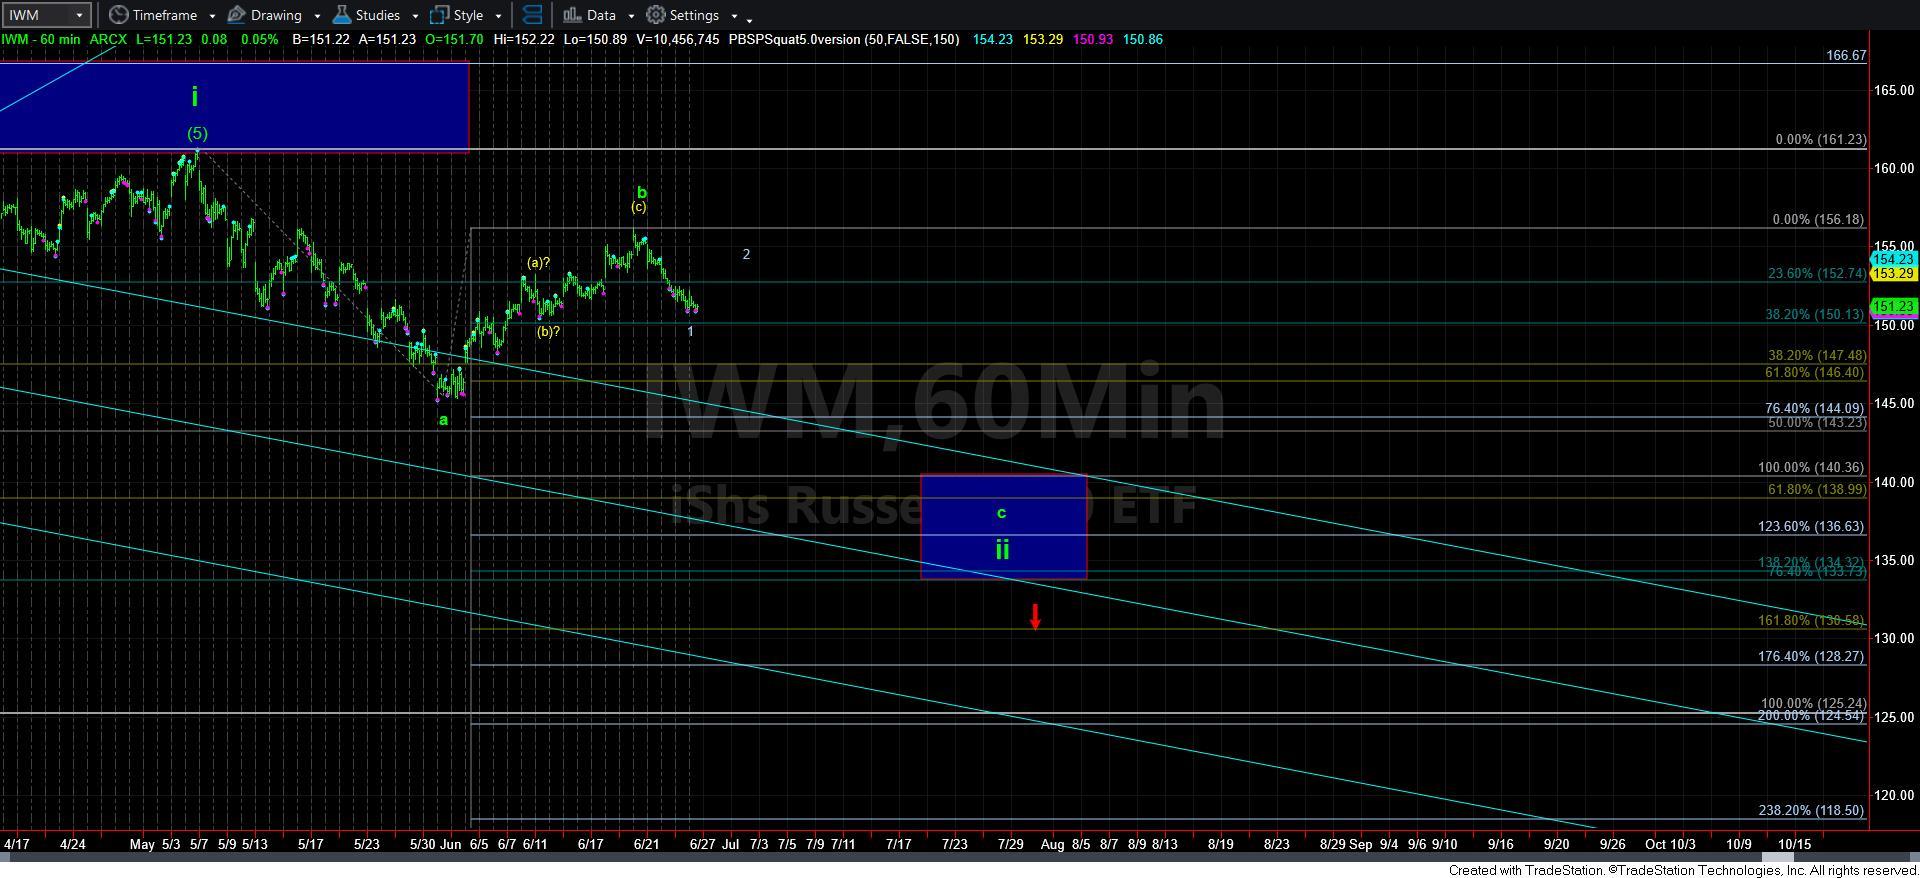
Moreover, the IWM is providing us with a strong signal of further downside to come. As you can see, the rally off the June low in IWM has been clearly corrective. Moreover, we seem to now be completing 5-waves down off that high. This strongly suggests that much lower levels will likely be seen in the coming weeks. So, while it is still possible that the SPX can reach for a higher high on the next rally, the IWM will likely only rally in a corrective wave 2. So, you have to recognize that risks have now risen further.
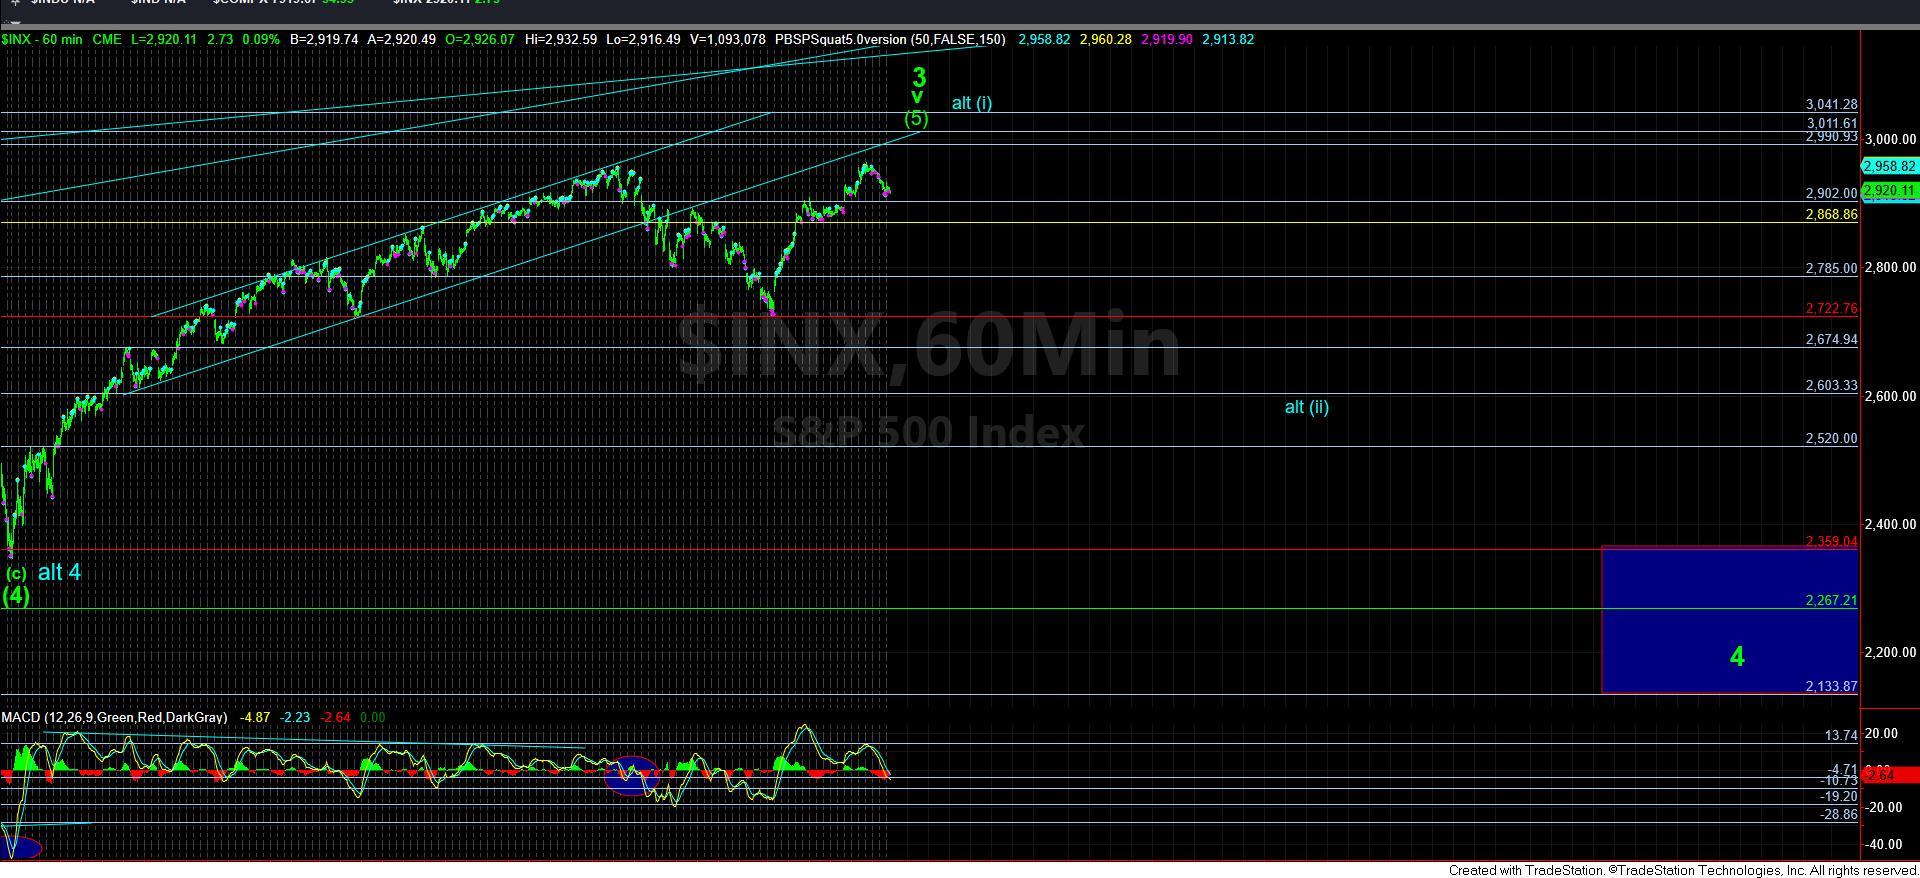
And, since I have been highlighting this chart as the most bullish argument I can make for the market, the question will be where the wave 3 down projects once waves 1 and 2 complete. You see, if the market is able to complete 5-waves down into the target box below, then I would have to view the decline as completing a bigger wave ii in IWM, which is a much more bullish structure.
However, if the 3rd wave down is comparable to what was seen in August of 2011 or January of 2016, it would break us below the target box below, and point us down to at least the 124 region in IWM, with a more ideal target in the 112 region.
But, the near term point of the charts we are reviewing now is that it is quite likely that the market is setting up to break back down below the June lows in the coming weeks/months. The question which will remain unanswered for now is whether the next decline will be comparable to what was seen in August2011/January2016 or something less destructive. My primary expectation remains that the market has much lower levels to target, but I will be watching that IWM chart for signs of bottoming in that target box below.